Stocks bounced and the major index ETFs closed modestly higher. Eight of the nine sector SPDRs were up. Energy fell because oil was down sharply. The decline in oil boosted the Airline ETF (JETS) and this helped the Transport iShares (IYT) to a 1.11% gain. Commodities were down pretty much across the board with big declines in Natural Gas ($NATGAS), the Palladium ETF (PALL) and the Aluminum ETN (JJU).
**This chart analysis is for educational purposes only, and should not
be construed as a recommendation to buy, sell or sell-short said securities**
Short-term Overview (Friday, 9-May-2015):
- Short-term breadth indicators are bearish.
- All five equal-weight sectors are in downtrends.
- SPY and QQQ are in short-term downtrends with lower highs and lower lows the last two weeks.
- QQQ formed a lower high and lower low, and
- IWM broke down first and remains in a short-term downtrend.
- TLT remains in a steep short-term downtrend and is short-term oversold.
- UUP remains in a short-term downtrend and is getting quite oversold.
- USO fell sharply, but remains in a short-term uptrend and above key support.
- GLD remains in a volatile short-term downtrend.
The Equal-Weight S&P 500 ETF (RSP) broke the early March trend line with a decline on Wednesday and then firmed on Thursday. With a lower high this week and a trend line break, one could argue for a short-term downtrend.
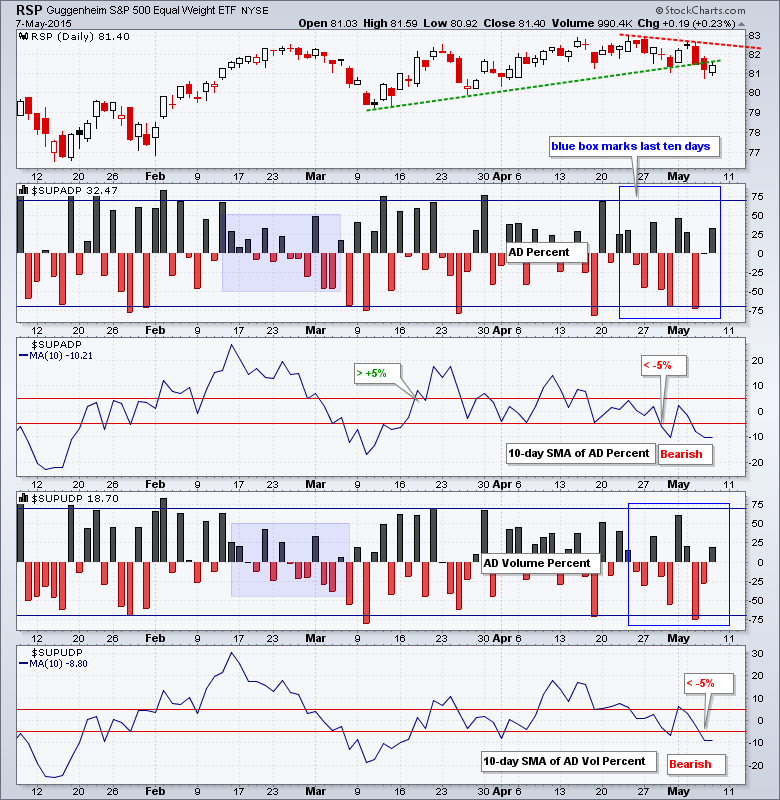
AD Percent and AD Volume Percent finished in positive territory, but buying pressure was not that strong. The 10-day SMA for AD Percent broke below -5% to turn bearish on April 29th and the 10-day SMA for AD Volume Percent turned bearish on May 6th. These two will remain short-term bearish until a break above +5%.
All five equal-weight sector ETFs are in downtrends. All five sectors bounced on Thursday, but remain below their resistance zones. It appears that the Equal-weight Technology ETF (RYT) and the Equal-weight Finance ETF (RYF) are holding up the best of the five.

**************************************************************

**************************************************************

**************************************************************

**************************************************************

**************************************************************

**************************************************************

**************************************************************

***************************************************************
Key Reports and Events (all times Eastern):
Fri - May 08 - 08:30 - Employment Report
Tue - May 12 - 00:00 - JOLTS
Wed - May 13 - 07:00 - MBA Mortgage Index
Wed - May 13 - 08:30 - Retail Sales
Wed - May 13 - 10:00 - Business Inventories
Wed - May 13 - 10:30 - Crude Oil Inventories
Thu - May 14 - 08:30 - Initial Jobless Claims
Thu - May 14 - 08:30 - Producer Price Index (PPI)
Thu - May 14 - 10:30 - Natural Gas Inventories
Fri - May 15 - 08:30 - Empire State Manufacturing
Fri - May 15 - 09:15 - Industrial Production
Fri - May 15 - 10:00 - Michigan Sentiment
Mon - May 18 - 10:00 - NAHB Housing Market Index
Tue - May 19 - 08:30 - Housing Starts/Building Permits
Wed - May 20 - 07:00 - MBA Mortgage Index
Wed - May 20 - 10:30 - Crude Oil Inventories
Wed - May 20 - 14:00 - FOMC Minutes
Thu - May 21 - 08:30 - Initial Jobless Claims
Thu - May 21 - 10:00 - Existing Home Sales
Thu - May 21 - 10:00 - Philadelphia Fed
Thu - May 21 - 10:00 - Leading Indicators
Thu - May 21 - 10:30 - Natural Gas Inventories
Fri - May 22 - 08:30 - Consumer Price Index (CPI)
Tue - May 26 - 08:30 - Durable Goods Orders
Tue - May 26 - 09:00 - Case-Shiller 20-city Index
Tue - May 26 - 09:00 - FHFA Housing Price Index
Tue - May 26 - 10:00 - New Home Sales
Tue - May 26 - 10:00 - Consumer Confidence
Wed - May 27 - 07:00 - MBA Mortgage Index
Thu - May 28 - 08:30 - Initial Jobless Claims
Thu - May 28 - 10:00 - Pending Home Sales
Thu - May 28 - 10:30 - Natural Gas Inventories
Thu - May 28 - 11:00 - Crude Oil Inventories
Fri - May 29 - 08:30 - GDP
Fri - May 29 - 09:45 - Chicago PMI
Fri - May 29 - 10:00 - Michigan Sentiment
This commentary is designed to stimulate thinking. This analysis is not a recommendation to buy, sell, hold or sell short any security (stock ETF or otherwise). We all need to think for ourselves when it comes to trading our own accounts. First, it is the only way to really learn. Second, we are the only ones responsible for our decisions. Think of these charts as food for further analysis. Before making a trade, it is important to have a plan. Plan the trade and trade the plan. Among other things, this includes setting a trigger level, a target area and a stop-loss level. It is also important to plan for three possible price movements: advance, decline or sideways. Have a plan for all three scenarios BEFORE making the trade. Consider possible holding times. And finally, look at overall market conditions and sector/industry performance.
