You got to give the bulls credit on Tuesday. The S&P 500 opened weak with a 20 point decline and move below 2090. This decline wiped out Friday's gain and made the bulls look weak. Instead of continuing lower though, the index immediately firmed and bounced back to the 2100 area. Overall, the major index ETFs finished with small losses. The technology and materials sectors were the weakest. The energy sector managed to gain as oil stayed strong. The industrials sector also held up relatively well and XLI is close to a triangle breakout on the daily chart. Elsewhere, banking stocks managed small gains with the Regional Bank SPDR (KRE) and Banking SPDR (KBE) closing slightly higher. The Global X Uranium ETF (URA) also closed higher and got a bounce off the 50-62% retracement zone.
**This chart analysis is for educational purposes only, and should not
be construed as a recommendation to buy, sell or sell-short said securities**
Short-term Overview (Wednesday, 13-May-2015):
- Short-term breadth indicators are bearish.
- Three equal-weight sectors are in downtrends and two are flat.
- SPY remains volatile, but refuses to break down.
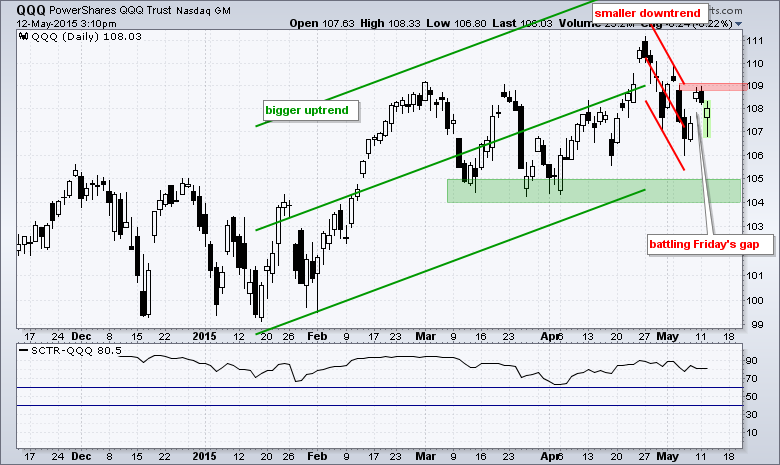
- QQQ fell into Friday's gap zone to affirm resistance and the short-term downtrend.
- IWM has turned volatile in May, but remains below its short-term support break (now resistance).
- TLT hit a new low for the move and remains in a short-term downtrend.
- UUP is firming, but remains in a short-term downtrend.
- USO is testing the pennant breakout and remains in a short-term uptrend.
- GLD got a mini breakout, but remains within a downtrend since early April.
The Equal-Weight S&P 500 ETF (RSP) dipped into the gap zone and then firmed. The ETF still closed lower and remains in a short-term downtrend with resistance marked at 82.5.
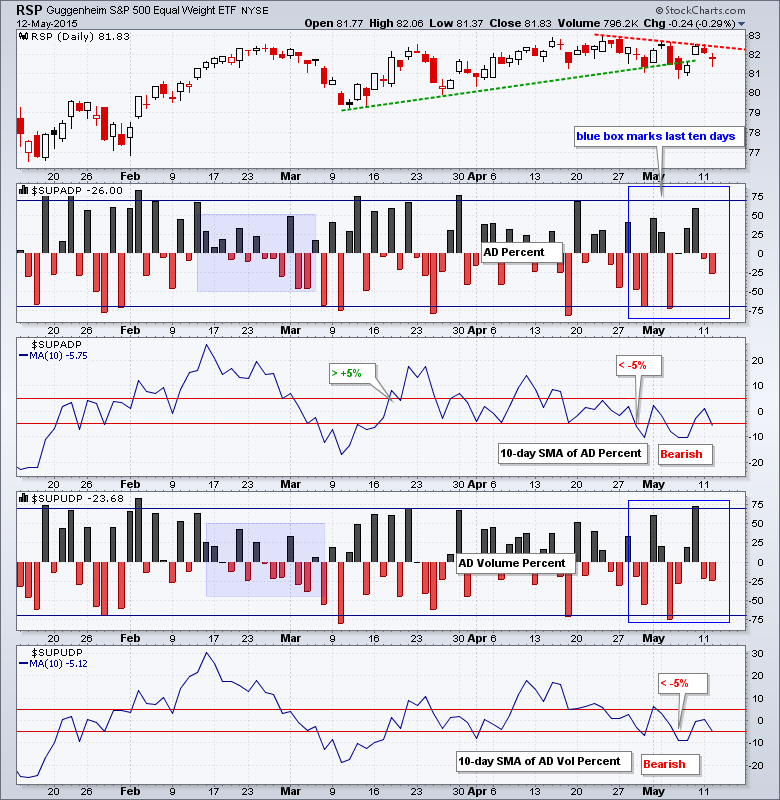
AD Percent and AD Volume Percent were slightly negative for the second day running. Once again, selling pressure was not that intense. The 10-day SMAs remain in bear mode after moving below -5% over the last few weeks.
The five equal-weight sector ETFs remain tough calls. The Equal-Weight Consumer Discretionary ETF (RCD) broke down in late April, but rebounded in May with an upswing. A break above last week's high is needed to reverse the late April break down. The Equal-weight Finance ETF (RYF) is perhaps the strongest of the five because it edged above the April highs and formed a higher low this week. The Equal-weight Technology ETF (RYT) is trending down since late April with lower highs. The Equal-weight Industrials ETF (RGI) is flat as a pancake, but trading near range resistance so watch for a breakout.

**************************************************************

**************************************************************
**************************************************************

**************************************************************

**************************************************************

**************************************************************

**************************************************************

***************************************************************
Key Reports and Events (all times Eastern):
Wed - May 13 - 07:00 - MBA Mortgage Index
Wed - May 13 - 08:30 - Retail Sales
Wed - May 13 - 10:00 - Business Inventories
Wed - May 13 - 10:30 - Crude Oil Inventories
Thu - May 14 - 08:30 - Initial Jobless Claims
Thu - May 14 - 08:30 - Producer Price Index (PPI)
Thu - May 14 - 10:30 - Natural Gas Inventories
Fri - May 15 - 08:30 - Empire State Manufacturing
Fri - May 15 - 09:15 - Industrial Production
Fri - May 15 - 10:00 - Michigan Sentiment
Mon - May 18 - 10:00 - NAHB Housing Market Index
Tue - May 19 - 08:30 - Housing Starts/Building Permits
Wed - May 20 - 07:00 - MBA Mortgage Index
Wed - May 20 - 10:30 - Crude Oil Inventories
Wed - May 20 - 14:00 - FOMC Minutes
Thu - May 21 - 08:30 - Initial Jobless Claims
Thu - May 21 - 10:00 - Existing Home Sales
Thu - May 21 - 10:00 - Philadelphia Fed
Thu - May 21 - 10:00 - Leading Indicators
Thu - May 21 - 10:30 - Natural Gas Inventories
Fri - May 22 - 08:30 - Consumer Price Index (CPI)
Tue - May 26 - 08:30 - Durable Goods Orders
Tue - May 26 - 09:00 - Case-Shiller 20-city Index
Tue - May 26 - 09:00 - FHFA Housing Price Index
Tue - May 26 - 10:00 - New Home Sales
Tue - May 26 - 10:00 - Consumer Confidence
Wed - May 27 - 07:00 - MBA Mortgage Index
Thu - May 28 - 08:30 - Initial Jobless Claims
Thu - May 28 - 10:00 - Pending Home Sales
Thu - May 28 - 10:30 - Natural Gas Inventories
Thu - May 28 - 11:00 - Crude Oil Inventories
Fri - May 29 - 08:30 - GDP
Fri - May 29 - 09:45 - Chicago PMI
Fri - May 29 - 10:00 - Michigan Sentiment
This commentary is designed to stimulate thinking. This analysis is not a recommendation to buy, sell, hold or sell short any security (stock ETF or otherwise). We all need to think for ourselves when it comes to trading our own accounts. First, it is the only way to really learn. Second, we are the only ones responsible for our decisions. Think of these charts as food for further analysis. Before making a trade, it is important to have a plan. Plan the trade and trade the plan. Among other things, this includes setting a trigger level, a target area and a stop-loss level. It is also important to plan for three possible price movements: advance, decline or sideways. Have a plan for all three scenarios BEFORE making the trade. Consider possible holding times. And finally, look at overall market conditions and sector/industry performance.
