Trading was rather quiet on Tuesday as the S&P 500 dipped in early trading, rebounded into positive territory by noon and then traded flat. The major index ETFs finished flat with fractional losses in IWM (-.30%) and SPY (-.01%). The sectors were mixed with small gains in consumer staples and finance. Banks extended their run as the Bank SPDR (KBE) and Regional Bank SPDR (KRE) gained around 1%. Energy stocks got a lift from oil as the USO Oil Fund (USO) and US Brent Oil ETF (BNO) surged over 2%. Both have bull flags working and should be watched for breakouts.
**This chart analysis is for educational purposes only, and should not
be construed as a recommendation to buy, sell or sell-short said securities**
Short-term Overview (Wednesday, 10-June-2015):
- Short-term breadth is bearish.
- All five equal-weight sector ETFs are in downtrends.
- SPY is in a two week downtrend and near support from the May lows.
- QQQ is in a short-term downtrend.
- IWM remains in a short-term uptrend and shows relative strength.
- TLT remains in a strong downtrend.
- UUP is testing the breakout zone once again.
- USO remains in a short-term downtrend that could be a bull flag.
- GLD fell below the April-May lows and remains in a downtrend.
The Equal-Weight S&P 500 ETF (RSP) fell for the fourth straight day and the eighth day of the last twelve. The ETF is down around 2.9% from its May high and this is the third 2+ percent decline since late March. RSP is short-term oversold with 20-day CCI moving below -100 and the 14-day Stochastic Oscillator below 20. The short-term trend is down, but ripe for a bounce.
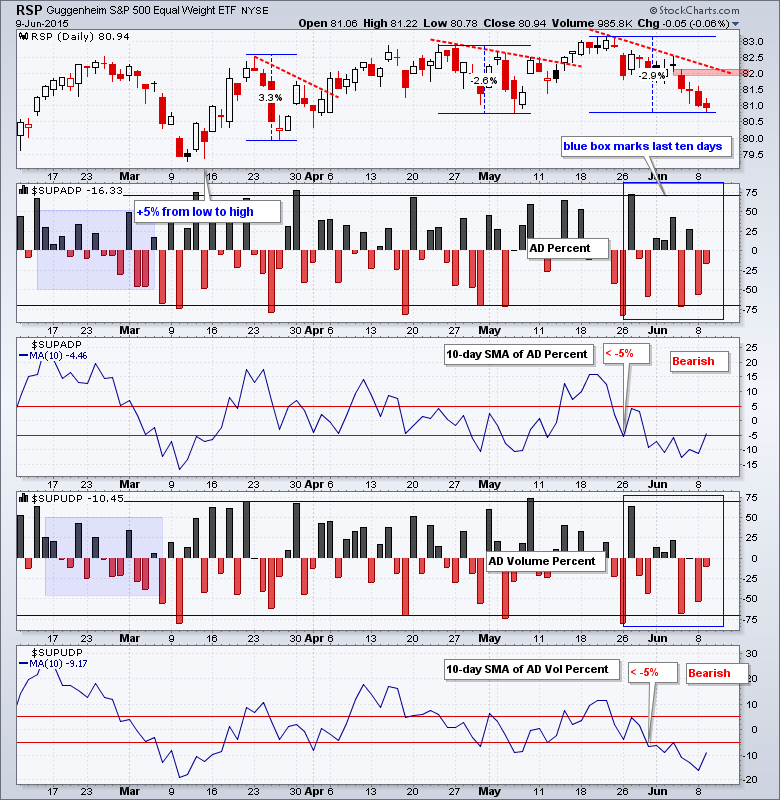
AD Percent and AD Volume Percent finished slightly negative as selling pressure abated somewhat. Nevertheless, we have not seen any strong buying pressure since May 27th when both moved above +50%. The 10-day SMAs remain in bear mode and will remain so until both break above +5%.
All five equal-weight sector ETFs fell over the last five days and one could make the argument for short-term downtrends in all five. The Equal-Weight Consumer Discretionary ETF (RCD) formed a lower high and fell to its early June low. The Equal-weight Finance ETF (RYF) has been trending lower since May 19th. The Equal-weight Industrials ETF (RGI) also peaked on May 19th and broke support in late May. The Equal-weight Technology ETF (RYT) joined the downtrends with a move below the late May low this week and even the Equal-weight Healthcare ETF (RYH) came under selling pressure in June.

**************************************************************

**************************************************************

**************************************************************

**************************************************************

**************************************************************

**************************************************************

**************************************************************

***************************************************************
Key Reports and Events (all times Eastern):
Wed - Jun 10 - 07:00 - MBA Mortgage Index
Wed - Jun 10 - 10:30 - Crude Oil Inventories
Wed - Jun 10 - 14:00 - Treasury Budget
Thu - Jun 11 - 08:30 - Initial Jobless Claims
Thu - Jun 11 - 08:30 - Retail Sales
Thu - Jun 11 - 10:00 - Business Inventories
Thu - Jun 11 - 10:30 - Natural Gas Inventories
Fri - Jun 12 - 08:30 - Producer Price Index (PPI)
Fri - Jun 12 - 10:00 - Michigan Sentiment
Mon - Jun 15 - 08:30 - Empire State Manufacturing
Mon - Jun 15 - 09:15 - Industrial Production
Mon - Jun 15 - 10:00 - NAHB Housing Market Index
Tue - Jun 16 - 08:30 - Housing Starts & Building Permits
Wed - Jun 17 - 07:00 - MBA Mortgage Index
Wed - Jun 17 - 10:30 - Crude Oil Inventories
Wed - Jun 17 - 14:00 - FOMC Rate Decision
Thu - Jun 18 - 08:30 - Initial Jobless Claims
Thu - Jun 18 - 08:30 - Consumer Price Index (CPI)
Thu - Jun 18 - 10:00 - Philadelphia Fed
Thu - Jun 18 - 10:00 - Leading Economic Indicators
Thu - Jun 18 - 10:30 - Natural Gas Inventories
Mon - Jun 22 - 10:00 - Existing Home Sales
Tue - Jun 23 - 08:30 - Durable Goods Orders
Tue - Jun 23 - 09:00 - FHFA Housing Price Index
Tue - Jun 23 - 10:00 - New Home Sales
Wed - Jun 24 - 07:00 - MBA Mortgage Index
Wed - Jun 24 - 08:30 - GDP
Wed - Jun 24 - 10:30 - Crude Oil Inventories
Thu - Jun 25 - 08:30 - Initial Jobless Claims
Thu - Jun 25 - 08:30 - Personal Income & Spending
Thu - Jun 25 - 08:30 - PCE Prices
Thu - Jun 25 - 10:30 - Natural Gas Inventories
Fri - Jun 26 - 10:00 - Michigan Sentiment
This commentary is designed to stimulate thinking. This analysis is not a recommendation to buy, sell, hold or sell short any security (stock ETF or otherwise). We all need to think for ourselves when it comes to trading our own accounts. First, it is the only way to really learn. Second, we are the only ones responsible for our decisions. Think of these charts as food for further analysis. Before making a trade, it is important to have a plan. Plan the trade and trade the plan. Among other things, this includes setting a trigger level, a target area and a stop-loss level. It is also important to plan for three possible price movements: advance, decline or sideways. Have a plan for all three scenarios BEFORE making the trade. Consider possible holding times. And finally, look at overall market conditions and sector/industry performance.
