Stocks rallied with a broad advance that lifted most boats. The sectors and industry groups that were hit the hardest over the last few months got the biggest bounces. These include energy, materials, mining, gold and steel. Elsewhere, the EW Consumer Discretionary ETF (RCD) surged 1.5% and held support. The Home Construction iShares (ITB) kept its uptrend alive with a 1.75% gain. Semis got an oversold bounce as the Semiconductor SPDR (XSD) gained 2%. Bonds pulled back as the market turned to riskier assets, such as stocks and commodities. Weakness in bonds weighed on utilities as this sector lost ground.
**This chart analysis is for educational purposes only, and should not
be construed as a recommendation to buy, sell or sell-short said securities**
Short-term Overview (Tuesday, 11-August-2015):
- Short-term breadth is bearish overall.
- Four of the five EW sector ETFs are in uptrends (RYT, RYH, RYF, RGI).
- SPY formed a lower high with a gap-surge, but remains below resistance.
- QQQ gapped up, but remains within a falling wedge.
- IWM got an oversold bounce, but remains within a downtrend and shows relative weakness.
- TLT remains in an uptrend.
- UUP fell back, but remains in an uptrend overall.
- USO got an oversold bounce within a bigger downtrend.
- GLD firmed for a few weeks and broke first resistance.
RSP held above the late July low, gapped up and closed strong. The gap held and prices moved higher after the gap. This is short-term bullish. A strong gap should hold so I will mark support at 79.40. A move below this level would fill the gap and reverse the short-term upswing. Note that RSP is still in a medium-term downtrend with lower lows and lower highs since late May.
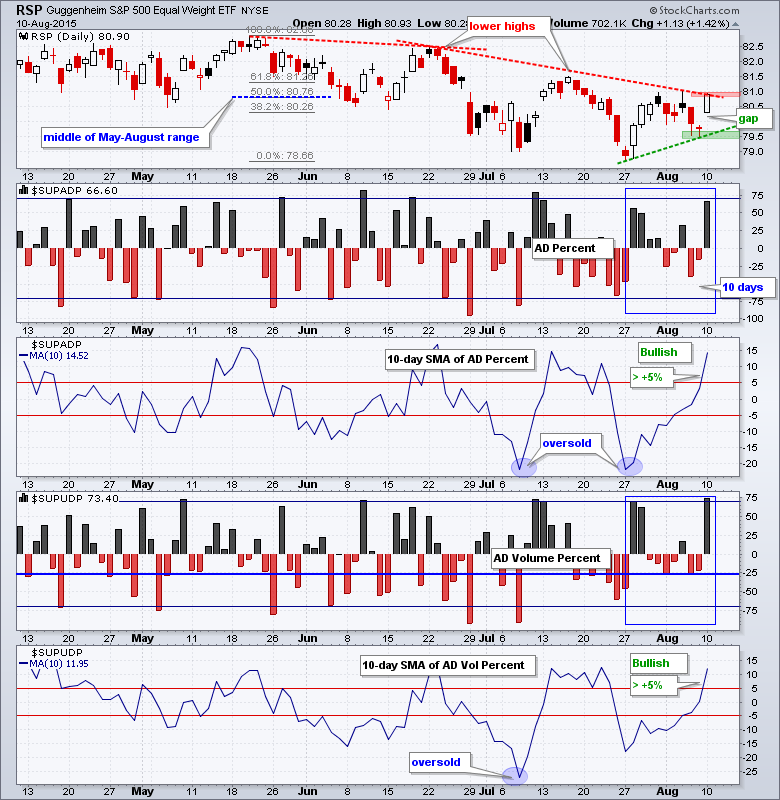
AD Percent surged to +66% and AD Volume Percent surged above +73%. Once again, AD Volume Percent was stronger than AD Percent and this points to strength in large-caps. The surge in AD Percent, however, was the strongest since mid July and it does represent the third up thrust in 10 days. The 10-day SMAs for AD Percent and AD Volume Percent both moved above +5% to turn bullish.
The sector balance is net bullish with four in uptrends and one flat. Consumer discretionary got a nice surge off support to keep the big trading range alive. Industrials broke out to finally reverse its short-term downtrend. Technology is still the strongest overall because it forged higher highs last week and this week.

**************************************************************

**************************************************************

**************************************************************

**************************************************************

**************************************************************

**************************************************************

**************************************************************

***************************************************************
Key Reports and Events (all times Eastern):
Wed - Aug 12 - 07:00 - MBA Mortgage Index
Wed - Aug 12 - 10:00 - JOLTS Jobs Report
Wed - Aug 12 - 10:30 - Crude Oil Inventories
Wed - Aug 12 - 14:00 - Treasury Budget
Thu - Aug 13 - 08:30 - Initial Jobless Claims
Thu - Aug 13 - 08:30 - Retail Sales
Thu - Aug 13 - 10:00 - Business Inventories
Thu - Aug 13 - 10:30 - Natural Gas Inventories
Fri - Aug 14 - 08:30 - Producer Price Index (PPI)
Fri - Aug 14 - 09:15 - Industrial Production
Fri - Aug 14 - 10:00 - Michigan Sentiment
Mon - Aug 17 - 08:30 - Empire Manufacturing
Mon - Aug 17 - 10:00 - NAHB Housing Market Index
Tue - Aug 18 - 08:30 - Housing Starts/Building Permits
Wed - Aug 19 - 07:00 - MBA Mortgage Index
Wed - Aug 19 - 08:30 - Consumer Price Index (CPI)
Wed - Aug 19 - 10:30 - Crude Oil Inventories
Wed - Aug 19 - 14:00 - FOMC Minutes
Thu - Aug 20 - 08:30 - Initial Jobless Claims
Thu - Aug 20 - 10:00 - Existing Home Sales
Thu - Aug 20 - 10:00 - Philadelphia Fed
Thu - Aug 20 - 10:00 - Leading Indicators
Thu - Aug 20 - 10:30 - Natural Gas Inventories
Tue - Aug 25 - 09:00 - Case-Shiller Housing Index
Tue - Aug 25 - 09:00 - FHFA Housing Price Index
Tue - Aug 25 - 10:00 - New Home Sales
Tue - Aug 25 - 10:00 - Consumer Confidence
Wed - Aug 26 - 07:00 - MBA Mortgage Index
Wed - Aug 26 - 08:30 - Durable Goods Orders
Wed - Aug 26 - 10:30 - Crude Oil Inventories
Thu - Aug 27 - 08:30 - Initial Jobless Claims
Thu - Aug 27 - 08:30 - GDP
Thu - Aug 27 - 10:00 - Pending Home Sales
Thu - Aug 27 - 10:30 - Natural Gas Inventories
Fri - Aug 28 - 08:30 - Personal Income & Spending
Fri - Aug 28 - 08:30 - PCE Prices
Fri - Aug 28 - 10:00 - Michigan Sentiment
Mon - Aug 31 - 09:45 - Chicago PMI
Tue - Sep 01 - 10:00 - Construction Spending
Tue - Sep 01 - 10:00 - ISM Manufacturing Index
Tue - Sep 01 - 17:00 - Auto/Truck Sales
Wed - Sep 02 - 07:00 - MBA Mortgage Purchase Index
Wed - Sep 02 - 08:15 - ADP Employment Report
Wed - Sep 02 - 10:00 - Factory Orders
Wed - Sep 02 - 10:30 - Crude Oil Inventories
Wed - Sep 02 - 14:00 - Fed's Beige Book
Thu - Sep 03 - 07:30 - Challenger Job Report
Thu - Sep 03 - 08:30 - Initial Jobless Claims
Thu - Sep 03 - 10:00 - ISM Services
Thu - Sep 03 - 10:30 - Natural Gas Inventories
Fri - Sep 04 - 08:30 - Employment Report
This commentary is designed to stimulate thinking. This analysis is not a recommendation to buy, sell, hold or sell short any security (stock ETF or otherwise). We all need to think for ourselves when it comes to trading our own accounts. First, it is the only way to really learn. Second, we are the only ones responsible for our decisions. Think of these charts as food for further analysis. Before making a trade, it is important to have a plan. Plan the trade and trade the plan. Among other things, this includes setting a trigger level, a target area and a stop-loss level. It is also important to plan for three possible price movements: advance, decline or sideways. Have a plan for all three scenarios BEFORE making the trade. Consider possible holding times. And finally, look at overall market conditions and sector/industry performance.
