Commentary Highlights: QQQ and SPY Near Highs // End of Month Seasonality // Regional Banks Power Finance Sector // 50% Participation is Enough to Power SPX // Software and Internet Lead Techs // GDX Fails to Break Out // Palladium Corrects after Impulse Surge // Oil Gets Oversold Bounce // Dollar Gets a Breakout // Dollar-Commodity Correlations Come Into Play ////
QQQ and SPY Near Highs
QQQ is within spitting distance of its July high, which was a 52-week high. QQQ is up around 15% in 21 trading days and SPY is up 11%. These are powerful moves in a short period of time. As noted previously, we saw a breadth thrust, a thrust in advancing volume and a price surge from September 29 to October 15. This kind of strength is medium-to-long term bullish and usually does not dissipate overnight. In other words, we saw a rocket lift off and the power was enough to reverse the bigger downtrends.
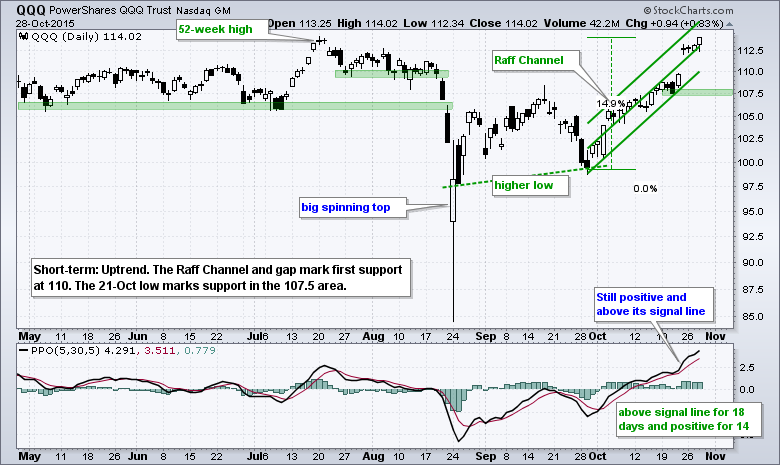
Short-term, SPY and QQQ are getting overbought. However, overbought is not that bearish because overbought conditions are more likely in a bull market than a bear market. Keep in mind that it takes strong buying pressure to become overbought. Short-term, the overbought conditions increase the chances of a pullback or consolidation, but pullbacks in the coming days could be relatively shallow as the performance pressure hits underinvested fund managers. Also note that the six month cycle turns bullish in November and history shows a bullish trading bias over the next few days.
End of Month Seasonality
We are currently at trading day number 20 for October and there is just two more trading days remaining. As the histogram from Fidelity Investments and Jeffrey Hirsch shows, days 19 and 20 have a strong upward bias and days 1 and 2 have a strong upward bias. This means the overbought market could hold up for a few more trading days.
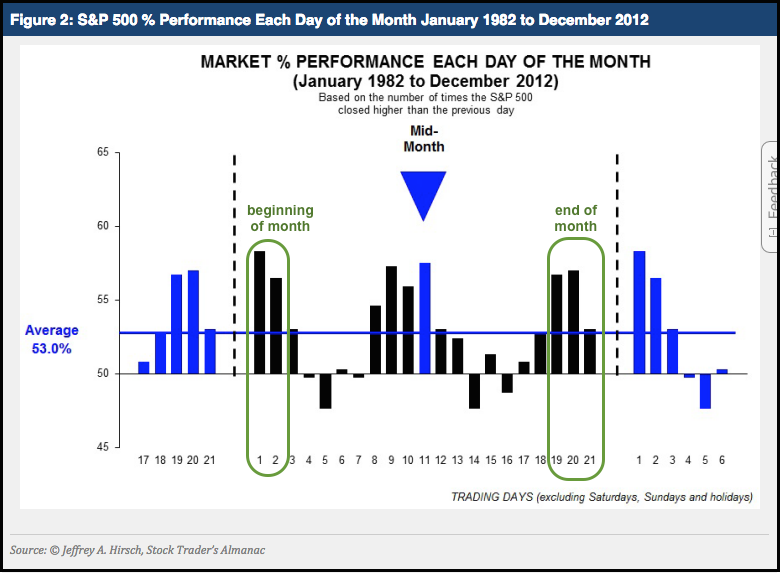
Our own Tom Bowley also documented this phenomenon in a blog post. Tom notes the following:
The most startling historical tendency indicated that ALL of the S&P 500 gains since 1950 had occurred from the 28th of one calendar month through the 6th of the subsequent calendar month. In other words, 10 consecutive calendar days within the month accounted for ALL of the S&P 500 gains over a 65 year period.
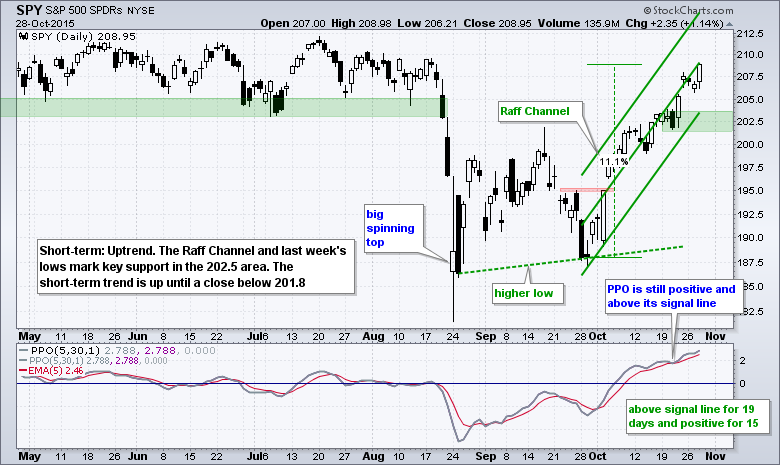
Returning to the chart, SPY is within 2% of its all time high and remains in a steep short-term uptrend. Notice that the PPO (5,30,5) has been above its signal line for 19 days and positive for 15 days. QQQ shows similar strength.
IWM Goes for a Breakout
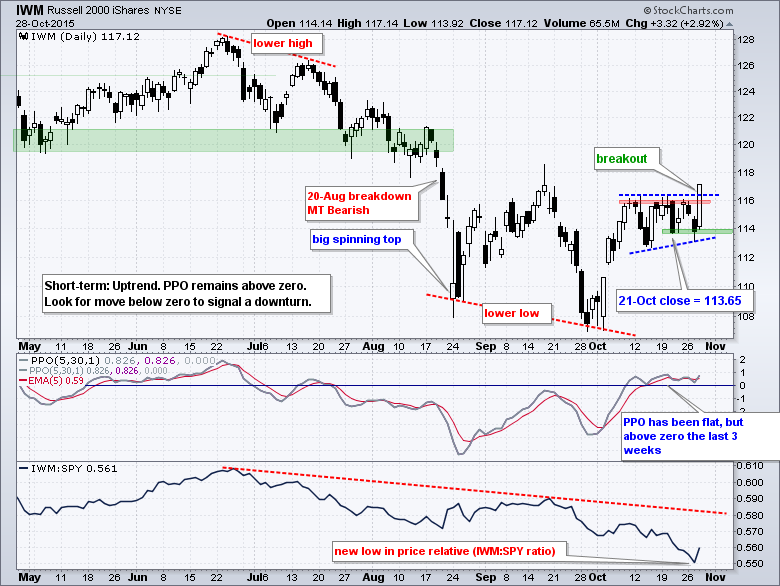
The biggest move on Wednesday came from small-caps as the Russell 2000 iShares (IWM) surged almost 3%. This shows a clear move towards the riskier side of the market because small-cap stocks have higher betas than large-cap stocks. Perhaps the January effect is starting a little early. On the price chart, IWM dipped on Tuesday, but held the 21-Oct low on a closing basis and kept the ascending triangle alive (but with a new trend line). The ETF broke out with a surge and this breakout is short-term bullish. Actually, the short-term trend was already up because the PPO (5,30,5) moved above zero in early October and held above zero. This means the 5-day EMA moved above the 30-day EMA and held above during the consolidation. I will set support at 113.65 on a closing basis and remain short-term bullish until a close below 113.5 (had to add a small buffer).
Regional Banks Power Finance Sector
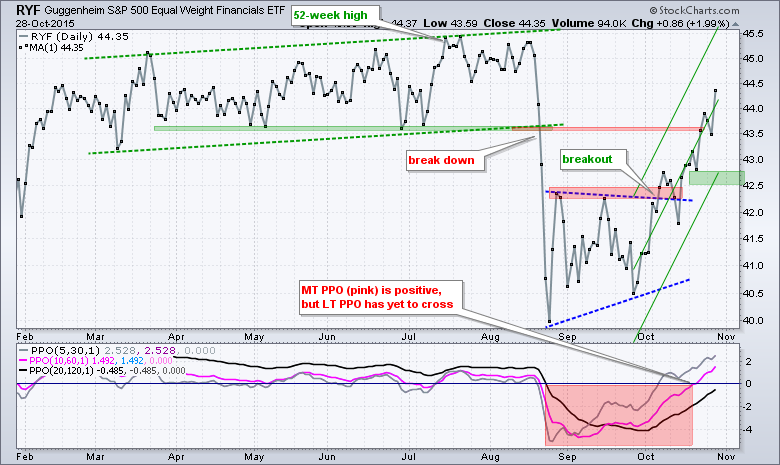
The EW Finance ETF (RYF) was one of the leading sectors on Wednesday and the ETF is now within 3% of its prior highs. The surge over the last four weeks was quite steep and shows enough strength to affect the long-term trend, even though the PPO (20,120,1) has yet to turn positive. Notice, however, that RYF negated its August support break and the PPO (10,60,1) is positive. The Raff Regression Channel extending up from late September and the 21-Oct low mark support in the 42.5-42.7 area.
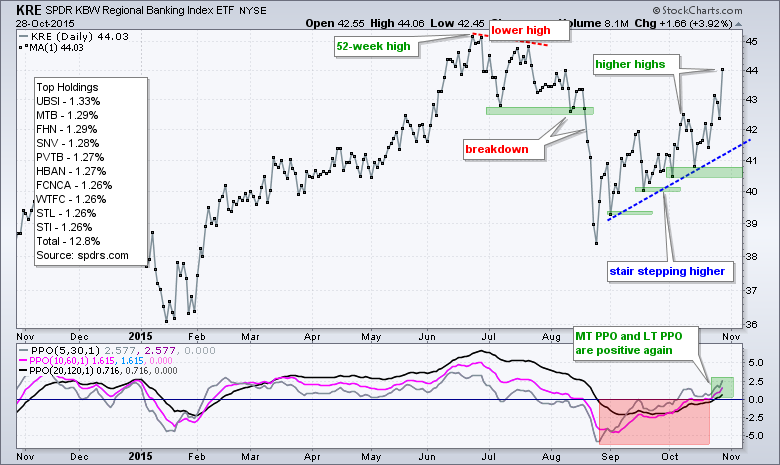
The August breakdown is looking like a fluke. The Regional Bank SPDR (KRE) hit a 52-week high in late June, broke down in August with a 10+ percent decline and is now within 3% of a 52-week high. KRE is now one of the strongest industry group ETFs with a SCTR of 99.1. Note that the SCTR held above 50 even during the August plunge and has been net positive (>50) since early May. KRE may be getting short-term overbought after a big run, but the trends are up and this is one to watch on pullbacks (i.e. when PPO (5,30,5) dips towards the zero line).
50% is Enough to Power the S&P 500
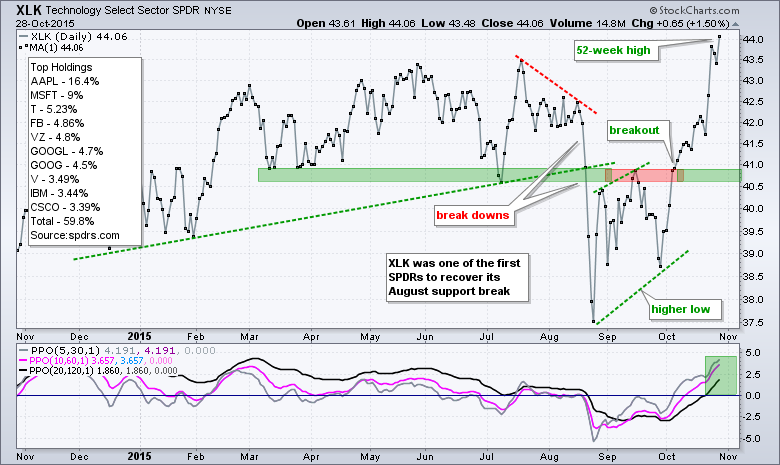
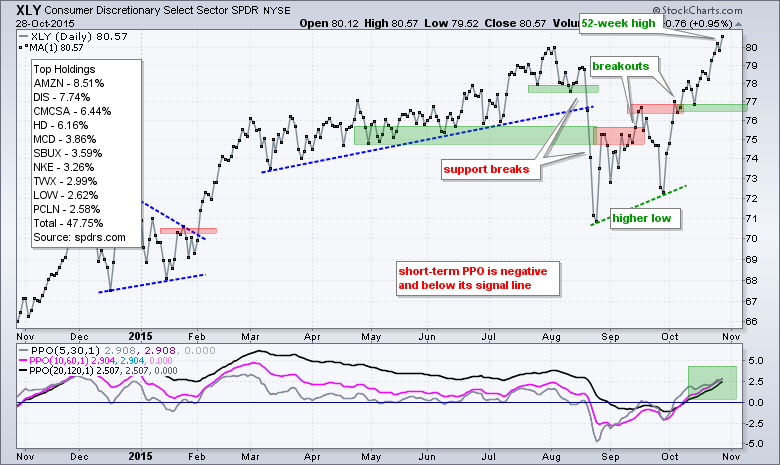
The technology sector remains the strongest sector throughout. As noted on Tuesday, the technology and consumer staples sectors were the two strongest sectors overall. The finance sector is a close third after Wednesday's surge. Even though there are some weak spots in the market, such as housing, retail and small-caps, strength in technology is a very positive force because it accounts for 21% of the S&P 500 and is the biggest sector. Also note that finance weighs in at 16.25% and consumer staples accounts for 9.9%. Together, these three sectors account for 47% of the S&P 500. Throw in a few large-cap consumer discretionary leaders and at least 50% of the S&P 500 is showing strength. That should be enough to at least tread water. Note that the Consumer Discretionary SPDR (XLY) also hit a new 52-week high this week.
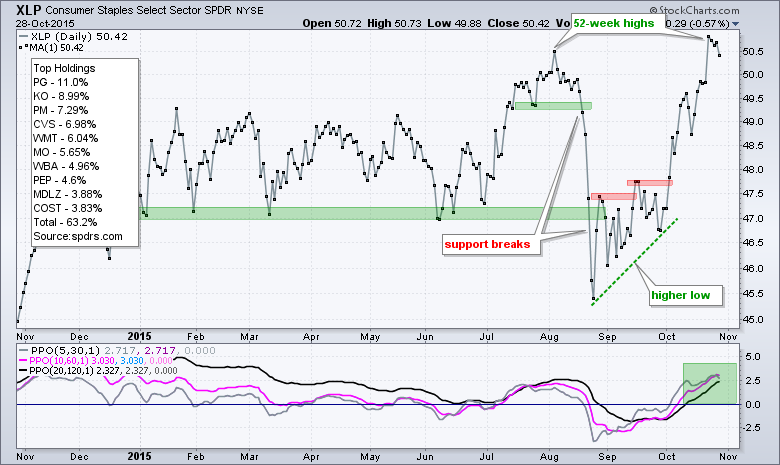
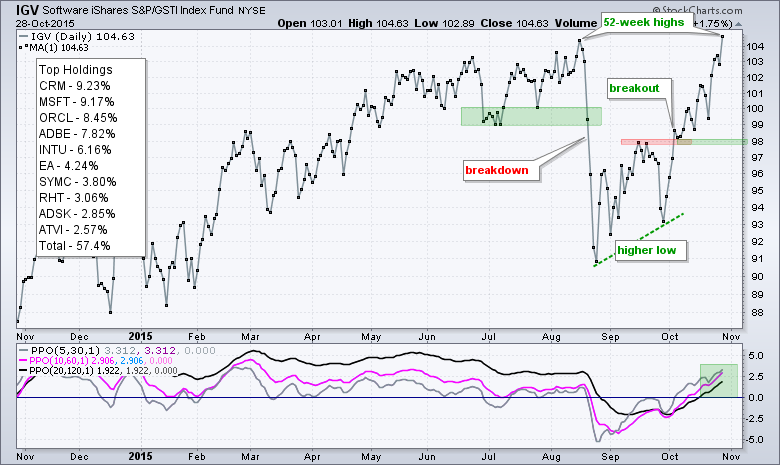
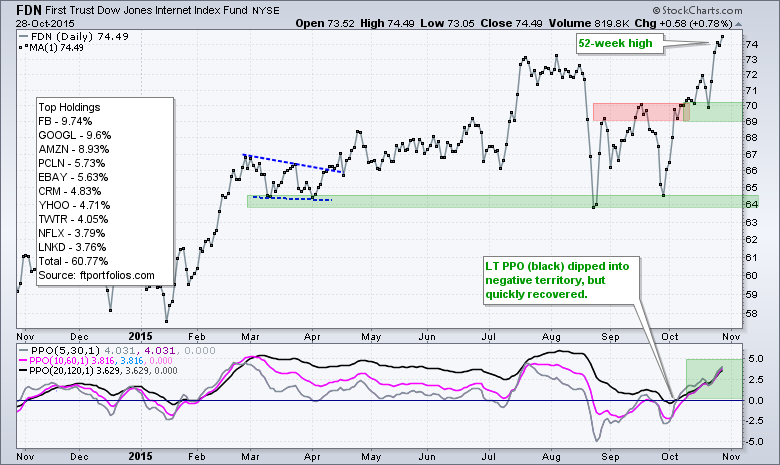
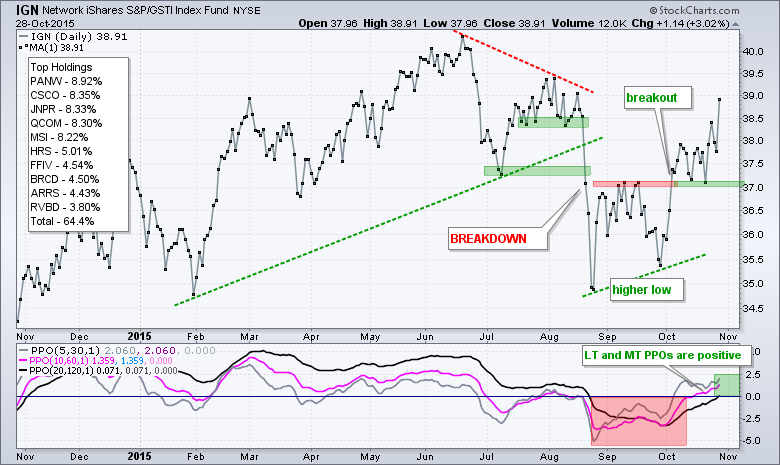
Software and Internet Lead Techs
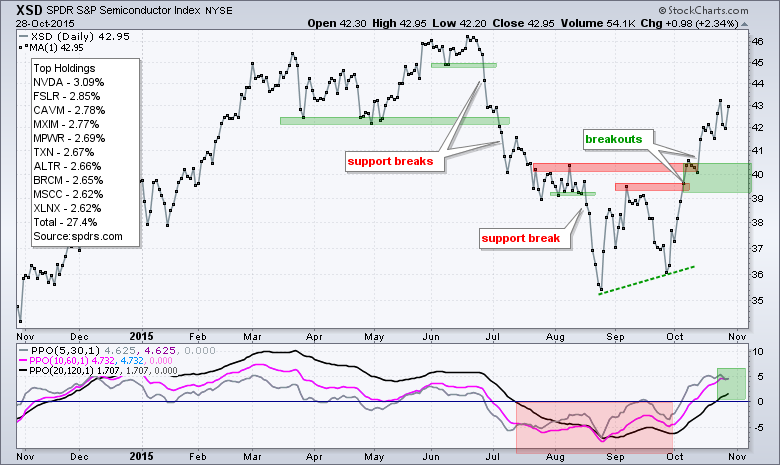
Within the technology sector, the Internet ETF (FDN) and Software iShares (IGV) hit new highs to lead the tech-related ETFs. The Networking iShares (IGN) and Semiconductor SPDR (XSD), however, are not far behind. Notice that the PPO (20,120,1) and PPO (10,60,1) are positive for all four ETFs. The only negative (overbought conditions) is actually a positive because it takes strong buying pressure to become overbought.
GDX Fails to Break Out
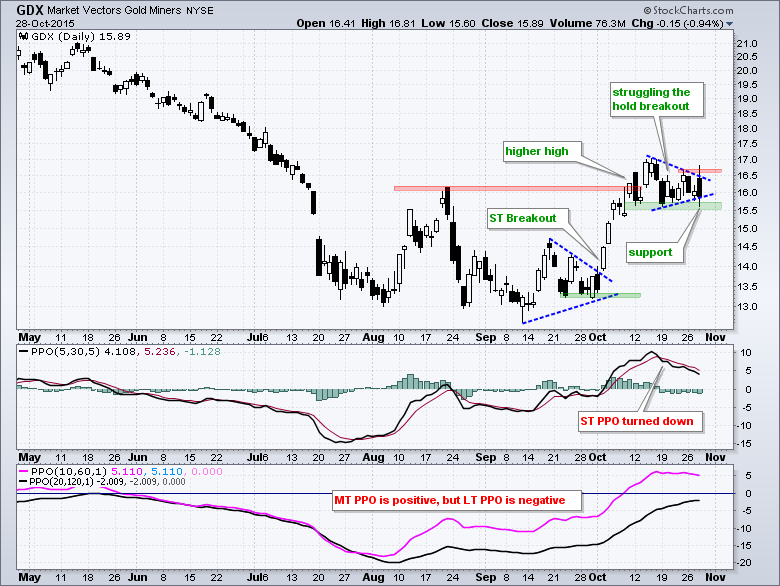
GDX remains on my radar for a failed breakout. The ETF formed a triangle after breaking its mid August high. GDX attempted to break triangle resistance on Wednesday, but failed and closed near the low end of its range. A support break at 15.5 would be bearish here. Note that the PPO (5,30,5) is still below its signal line and falling.
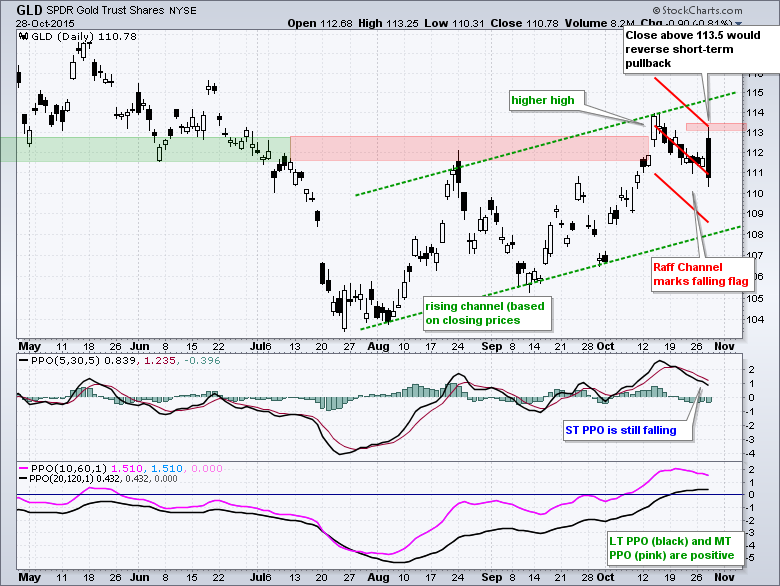
The price action in the Gold SPDR (GLD) was also negative as the ETF surged above 113 intraday and closed below 111. Volatility is why I set my breakout level based on a CLOSE above 112.75. With this spike, I redrew the Raff Regression Channel and will now require a close above 113.5 to turn bullish on gold. Chartists can also look for the PPO (5,30,5) to cross above its signal line.
Palladium Corrects after Impulse Surge
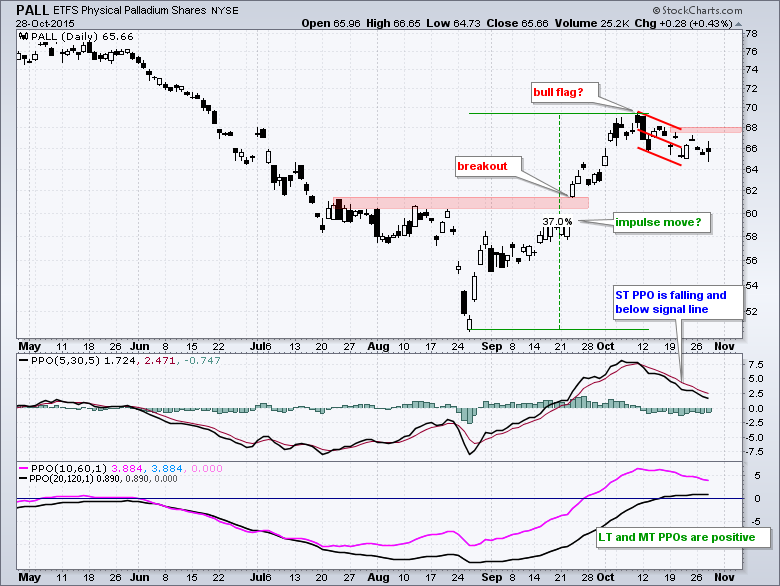
The Palladium ETF (PALL) surged some 37% from late August to early October and then corrected with a falling flag the last few weeks. Palladium is part precious metal and part industrial metal so I am not quite sure what to make of this surge, except that the steepness makes me think it is an impulse move. I am, therefore, watching flag resistance at 68 for a breakout that would signal a continuation higher. Strength in the Dollar could prevent a breakout though (see correlation chart below).
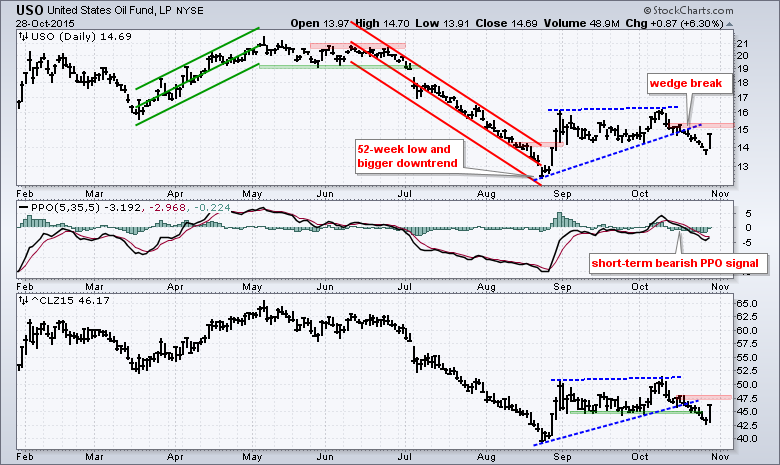
Oil Gets Oversold Bounce
The USO Oil Fund (USO) surged with a 6+ percent gain on Wednesday. This is impressive and the strength pushed December Crude Futures (^CLZ15) above 45. Despite these big gains, I am not ready to turn bullish on oil. The wedge break remains in force, the medium-term and long-term PPOs are negative and the PPO (5,30,5) is below zero. A little follow through is needed before taking this bounce seriously. USO resistance is set at 15.5 and December Crude resistance at 48 (closing basis). In a separate, but related event, NatGas hit a three year low this month.
Dollar Gets a Breakout
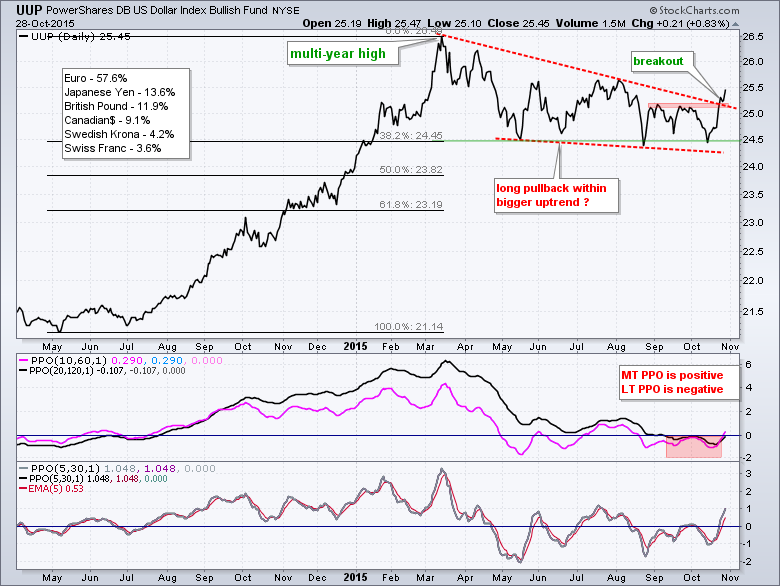
It looks like the US Dollar ETF (UUP) is ending its long downtrend and resuming its even longer uptrend. UUP surged from May 2014 to March 2015 with a monster advance that looks like a big impulse move. The ETF then embarked on an extended correction with a falling wedge the last seven months. With its third bounce off the 38.2% retracement level, UUP broke wedge resistance and exceed its Sep-Oct peaks. This is long-term bullish and points to new highs in the coming weeks and months.
Dollar-Commodity Correlations Come into Play
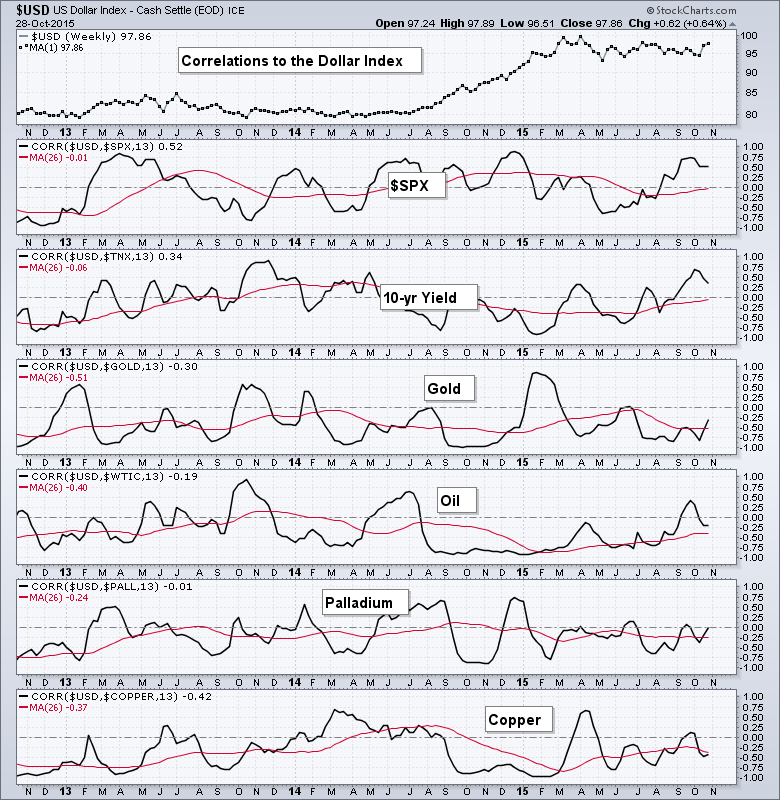
This last chart shows the Dollar Index ($USD) in the top window and the 13-week Correlation Coefficient for the Dollar and six other instruments. The red line is the 26-week EMA of the Correlation Coefficient. Overall, notice that gold, oil, palladium and copper are mostly negatively correlated to the Dollar. This means they tend to decline when the Dollar rises, and visa versa. Gold seems to have the most negative correlation because its red line never turned positive. Oil, Palladium and Copper also have some pretty strong negative correlations.
****************************************
Thanks for tuning in and have a good day!
--Arthur Hill CMT
Plan your Trade and Trade your Plan
*****************************************
