Pockets of Strength?
The evidence for the broad stock market turned bearish last week and there are clearly some big pockets of weakness out there. Nevertheless, there are lingering pockets of strength within large-caps and large-cap techs. The S&P 500 is around 5.5% from its 52-week high and the Nasdaq 100 is around 3.5% from its 52-week high. At the very least, the S&P 500 and Nasdaq 100 show relative strength, while the Russell 2000, S&P MidCap 400 and S&P 500 Equal-Weight Index show relative weakness. The latter three are nine to fourteen percent below their 52-week highs.
The sector balance tilted towards the bears over the last few days because the majority broke their mid November lows and have bearish breadth indicators. However, we have yet to see breakdowns in the technology and consumer staples sector, which represent 22% of the S&P 500 Equal-Weight Index and 32% of the cap-weighted S&P 500. I am also seeing some relative strength in healthcare recently and will be focusing on several healthcare stocks today.
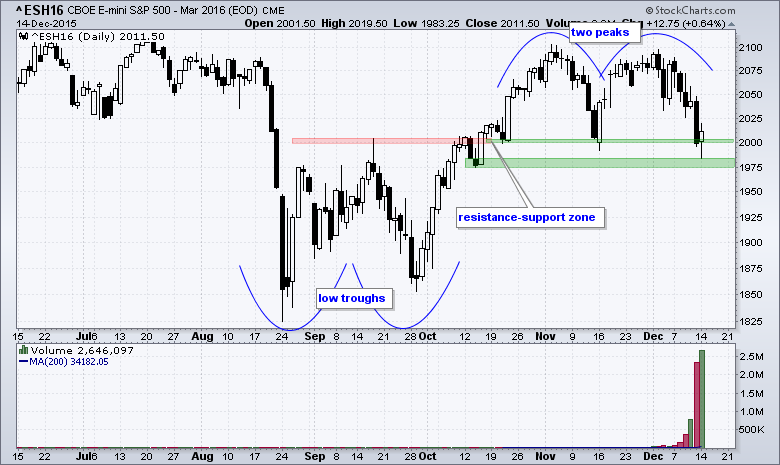
E-mini Tests 2000 Again
The E-mini contract on the CBOE is available at StockCharts as an end-of-day (EOD) symbol. As with SPY, it is actually traded and this means support levels are based on actual buying pressure. A break below a support level signals a significant amount of expansion of selling pressure. On the price chart, the March E-mini S&P 500 (^ESH16) has a mirror image working since the August low. Notice the two troughs, the two peaks and resistance-support in between. This resistance-support zone marks the battle line for the bulls and bears. The bulls broke above resistance in mid October, successfully defended this breakout in mid November and are now making another stand. The E-mini dipped below 1990 on Monday, but recovered and closed above 2010. Yes, the bulls are making another stand. Adding a buffer, I would suggest that 1975 is THE level to watch. An intraday break below this level would be cause for alarm and suggest that material selling pressure was finally extending to large-caps. I will show how to find futures symbols in today's webinar.
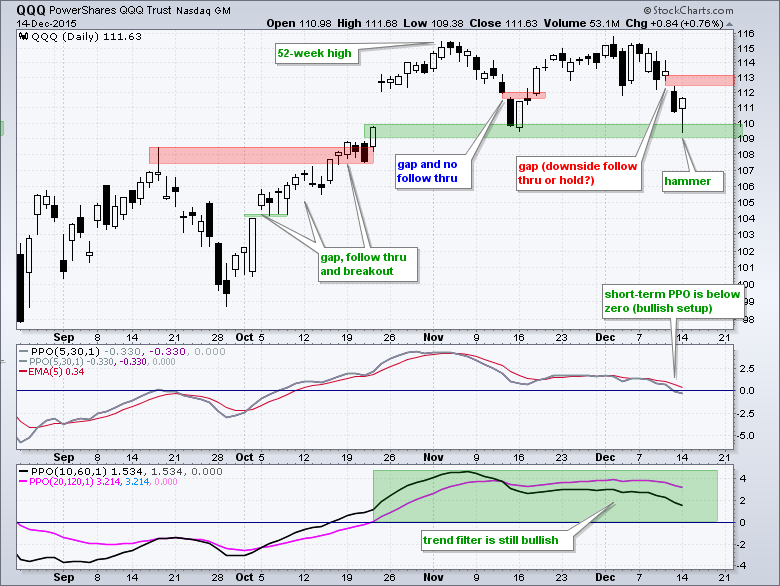
QQQ Holding above November Low
QQQ remains the strongest of the broad market ETFs and the Nasdaq 100 is the strongest of the major stock indices. Both hit new highs (intraday) in early December and both held above their mid November lows this month. Any ETF or stock that hit a new high in November or December and held its mid November low shows relative "chart" strength. QQQ tested support with a dip into the 109-110 zone and recovered with a close near the high-of-the-day. A hammer formed on Monday and a follow thru breakout at 113 would reverse the short-term downswing. The indicator windows show the trend filter as bullish because the medium-term PPO (10,60,1) and long-term PPO (20,120,1) are both positive. The short-term PPO (5,30,1) has a bullish setup in play because it dipped below zero. A move back above zero would signal that the 5-day EMA has crossed above the 30-day EMA and this would be short-term bullish.
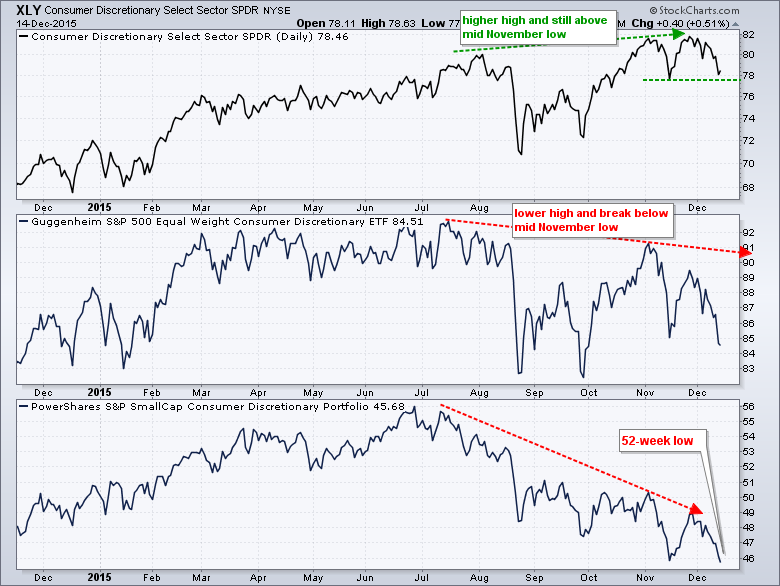
Small, Mids and Equals Extend Suffering
We can see that it is a large-cap world by using some simple ratio charts. The chart below shows the Russell 2000 iShares (IWM) relative to the S&P 500 SPDR (SPY) using the IWM:SPY ratio. I am also showing the S&P MidCap SPDR (MDY) relative to SPY and the EW S&P 500 ETF (RSP) relative to SPY. These three ETFs capture most of the non-large-cap universe. There are two breakdowns identified on each chart. Relative performance in IWM and MDY broke down in March-April 2014 and relative performance in RSP broke down in September 2014. Note that the RSP relative breakdown occurred just before the broad market decline in October 2014.
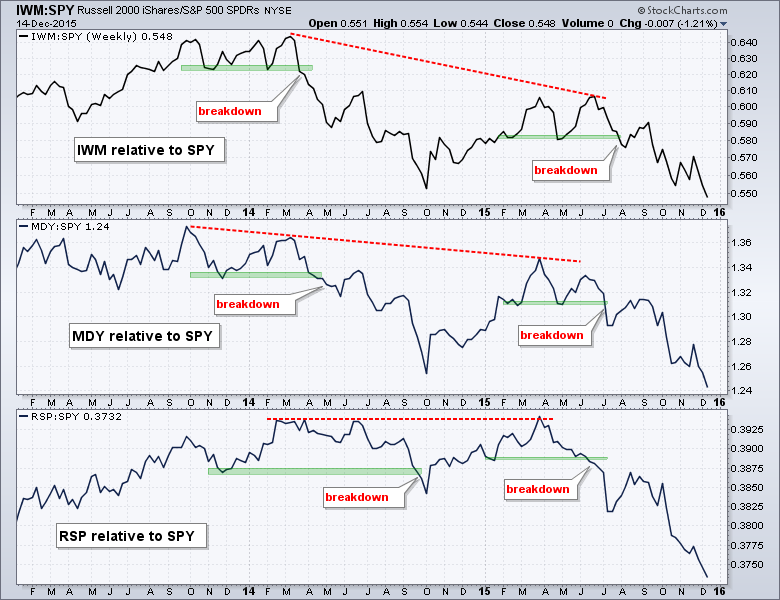
Relative performance in IWM and MDY rebounded and then broke down again in July 2015. This time, however, relative performance in RSP broke down before the other two as the price relative broke support in June. All three ratio charts hit new lows in early December and this reflects relative weakness. Small-caps, mid-caps and equal-weights are still to be avoided as a group. As noted in Saturday's commentary, the weekly trend indicators for the Russell 2000, S&P MidCap 400 and S&P 500 Equal-Weight Index turned bearish on August 21st and have remained bearish. I do not know how long these three will underperform, but it is a negative for the broader market and could eventually weigh on large-caps. The chart below shows the EW Consumer Discretionary ETF (RCD) underperforming the Consumer Discretionary SPDR (XLY) with a lower high in November and the SmallCap Consumer Discretionary ETF (PSCD) underperforming RCD with a 52-week low this week.
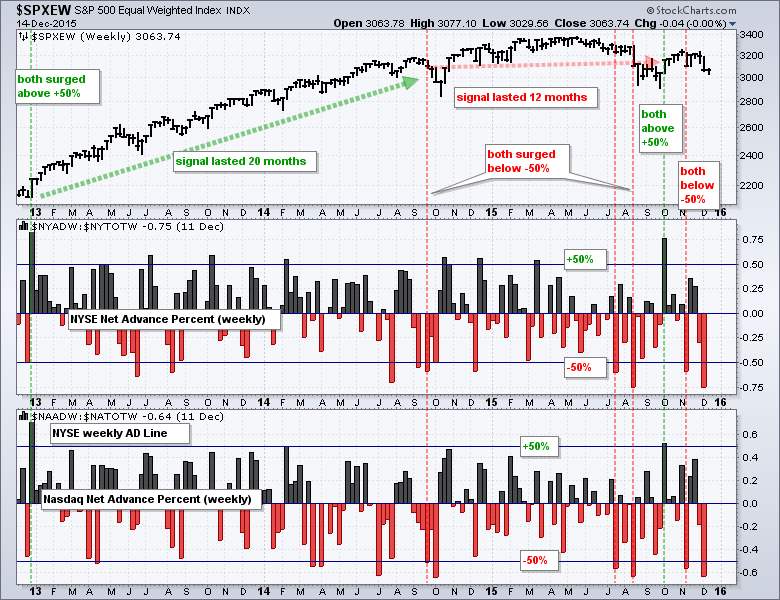
Weekly Breadth Indicators Remain Bearish
StockCharts provides data for some weekly breadth indicators and these are updated every Friday a few hours after the close. These are good for a longer term outlook because they filter out some of the day-to-day noise. The first chart shows the weekly AD Percent for the NYSE and Nasdaq. AD Percent is the difference between advances and declines divided by total issues. A bearish signal triggers when BOTH dip below -50% the same week and a bullish signal triggers when both surge above +50% the same week. Such moves reflect broad buying or selling pressure that can ignite a broad market trend. There was a bullish signal in early October, but this was negated with a bearish signal in early November. Notice that this bearish signal was confirmed again in early December when both plunged below -50%. Keep in mind that the advance-decline indicators favor small and mid-caps so this confirms what we are seeing in relative performance metrics.
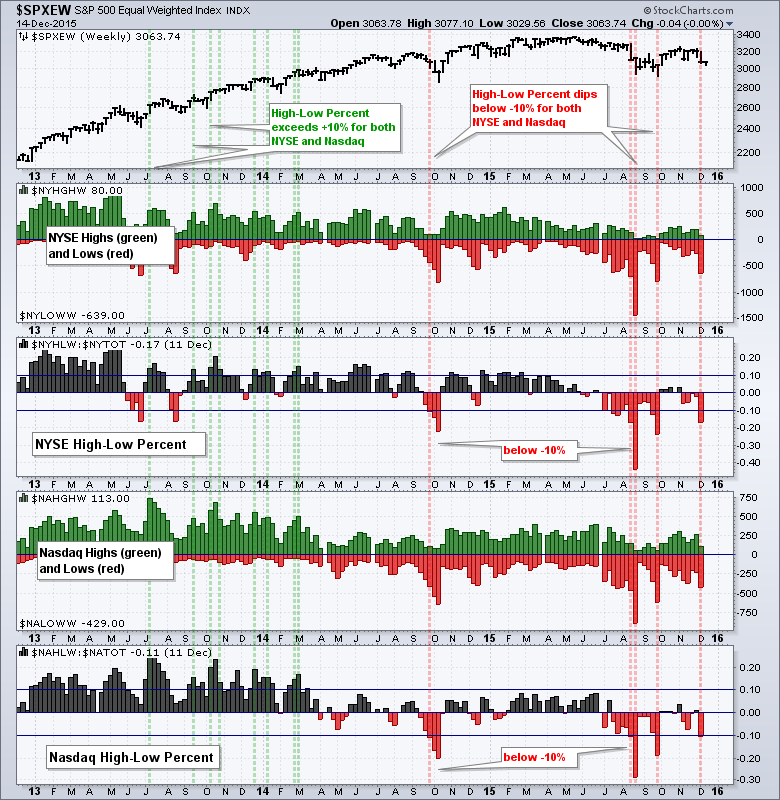
The next chart shows weekly new highs, new lows and high-low percent for the NYSE and Nasdaq. High-Low Percent is the difference of new highs and new lows divided by total issues. This indicator is bullish when weekly High-Low Percent exceeds +10% for BOTH the NYSE and Nasdaq. The signals are not very frequent because we have seen just two signals since January 2012. The indicator turned bullish in January 2012 and bearish in September 2014. Notice that High-Low Percent on the NYSE exceed +10% several times from November to February, but Nasdaq High-Low Percent did not confirm. Both moved below -10% in August, September and now December. Thus, the bear signal has been confirmed. Again, this indicator is more representative of small and mid-caps.
Finance and Industrials Tilt the Balance
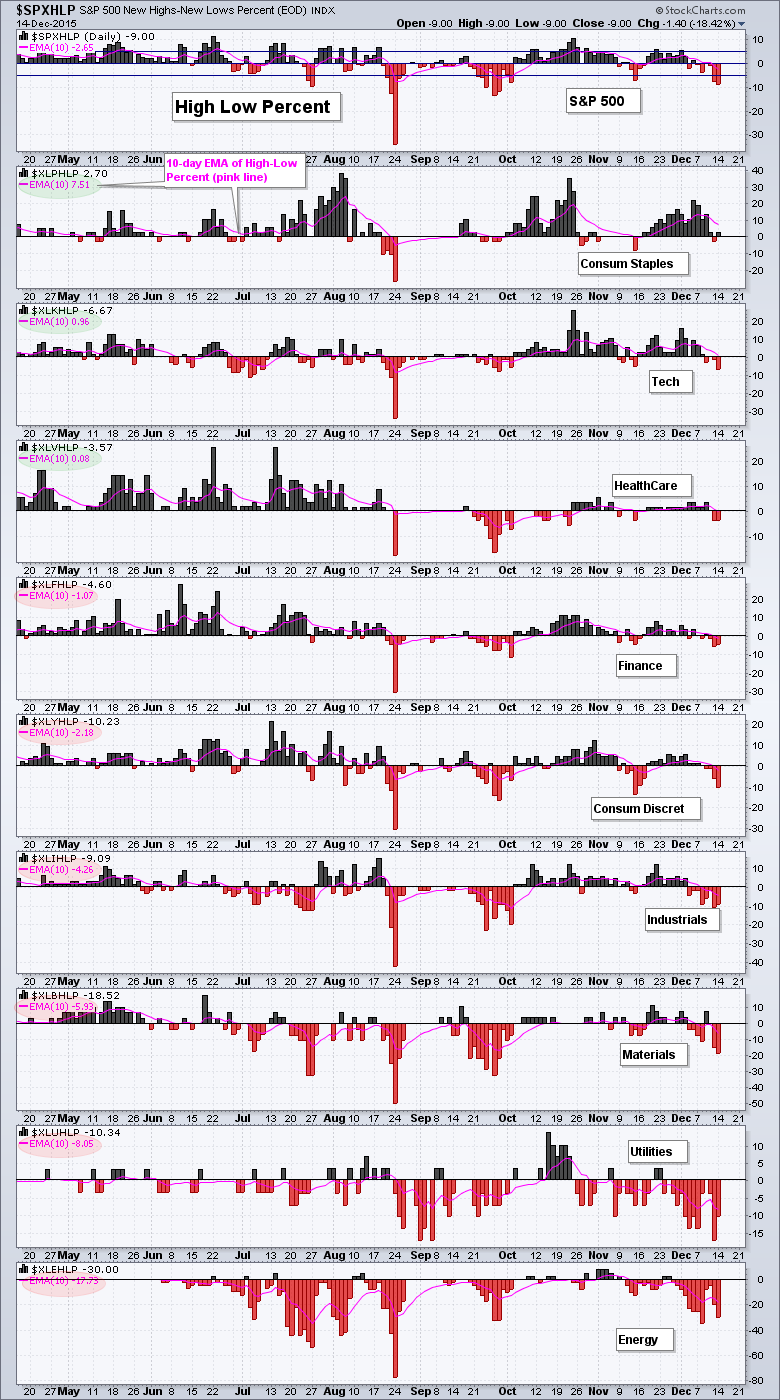
The next charts look at the nine sectors and show that the balance has tilted towards the bears. These sectors are based on the stocks in the S&P 500. At its most basic, the index has an upward bias when five of the nine sector indicators are bullish and a downward bias then five of the nine are bearish. It is also important which sectors are bullish and which are bearish. The first chart shows the percentage of stocks above the 200-day EMA for each sector. Sector breadth is deemed bullish when this indicator moves above 60% and stays bullish until a move below 40%. Instead of using the 50% line for signals, I added buffers to help reduce whipsaws. Consumer staples is by far the strongest using this indicator because 78% of its components are above their 200-day moving average. Technology, healthcare and utilities are still on bullish signals, but these three fell back to the 50% area. Bearish signals triggered this week for industrials and finance, and these signals tilted the balance of power to the bears. Thus, consumer discretionary, industrials, finance, materials and energy are all below 40%, which means 60% of their components are below their 200-day EMA.
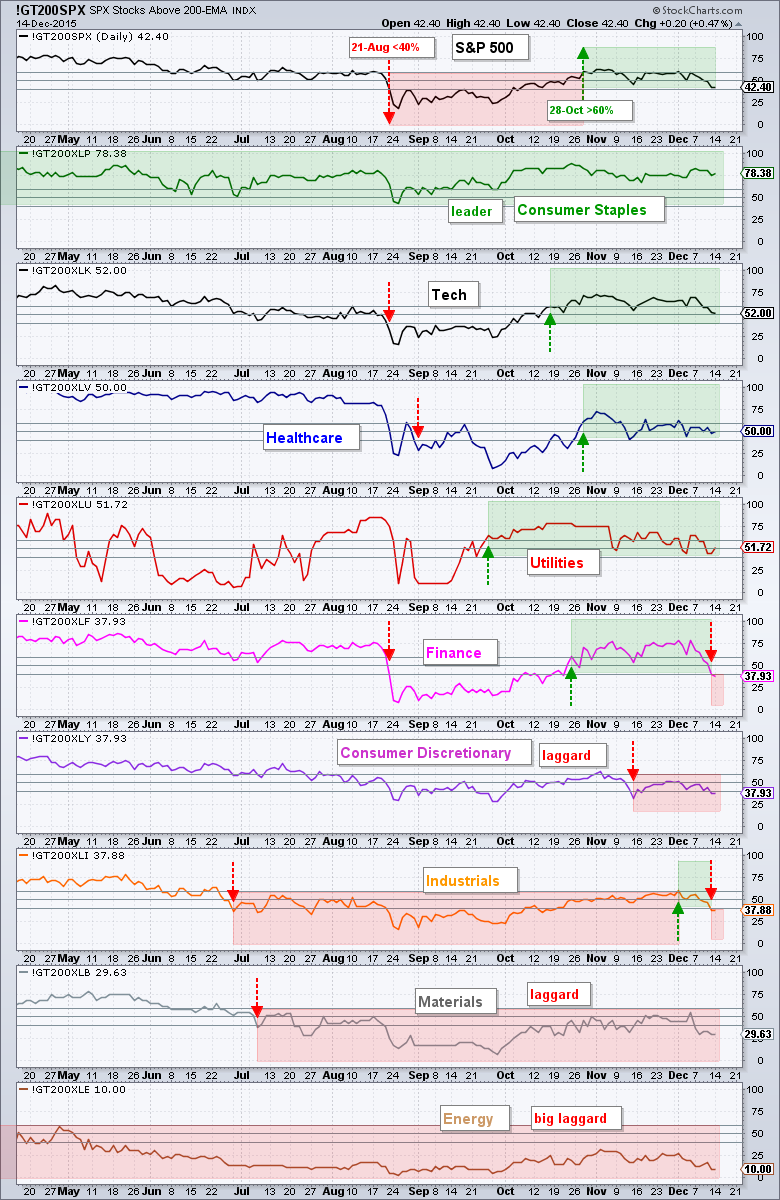
I also went through this same exercise with the 10-day EMA of High-Low Percent for the nine sectors (pink lines). Again, consumer staples, technology and healthcare are the top sectors because the 10-day EMA for High-Low Percent remains positive. This means we did not see a significant expansion of new lows last week. The 10-day EMA for High-Low Percent is negative for the other six sectors though. Utilities, energy and materials have the most new lows. The industrials and consumer discretionary sectors also saw an uptick in new lows the last two days.
****************************************
Thanks for tuning in and have a good day!
--Arthur Hill CMT
Plan your Trade and Trade your Plan
*****************************************
