Long-term Trends Versus Short-term Conditions // Analyzing the 2000 and 2007 Tops // Applying Recent History to Current Price Action // Three Positive Characteristics for Utilities // Yield Alternatives Shine // Bonds Gets Extended, but Still Bullish // First Target for Oil Bounce // Gold Hits Key Retracement Zone // Dollar Holds Breakout - Euro and Yen Fail // Friday Food for Thought ////
Long-term Trends Versus Short-term Conditions
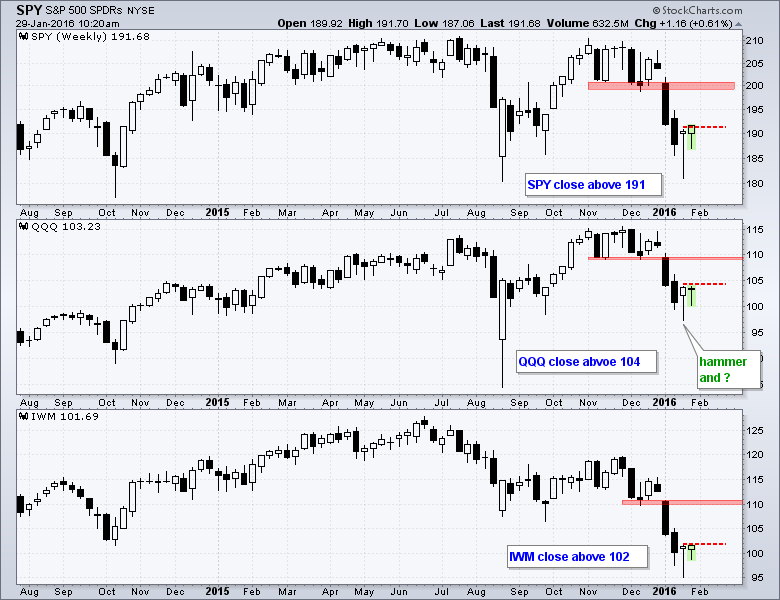
There are two competing forces active in the stock market right now: the long-term downtrends versus hammers and oversold conditions. The long-term trend indicators turned net negative in late August (IWM), late December (SPY) and mid January (QQQ). Note that there are links to the long-term trend indicator article and other key articles at the bottom of this commentary. These ETFs fell double digits from late December to mid January (four weeks) and became quite oversold. This is not necessarily short-term bullish, but it does increase the chances that we will see choppy price action or a counter-trend bounce. Note that SPY, IWM and QQQ formed hammers last week and a good close today would confirm these hammers. A confirmed weekly hammer would argue for a short-term bounce, which could last a few days or a few weeks. The red zones on the chart below mark first resistance. Before getting too short-term bullish, keep in mind that the long-term trends are down and these are the dominant forces at work. Judging from the last two market tops, we are likely to see choppy price action that frustrates both bulls and bears for a few weeks.
Analyzing the 2000 and 2007 Tops
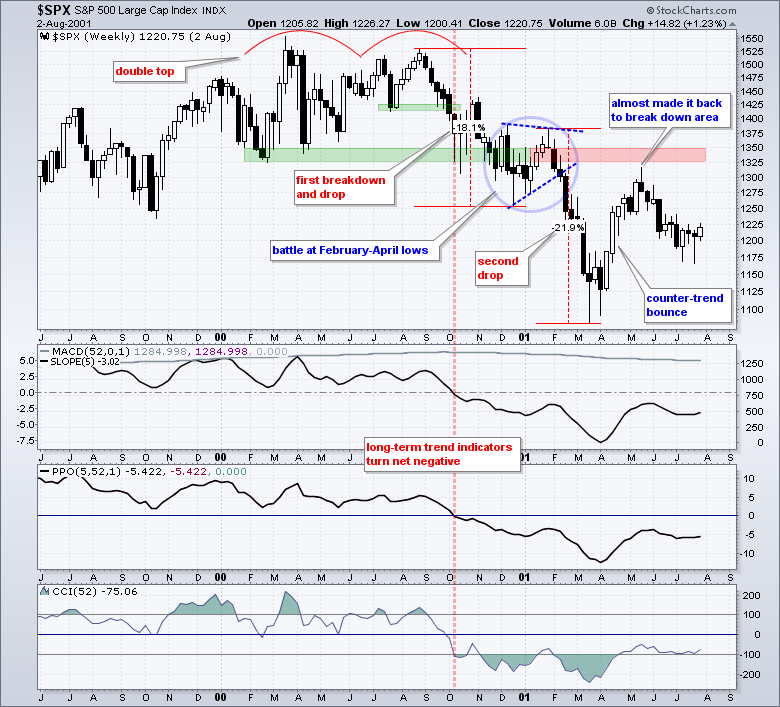
Let's look at the last two market tops and compare them to the current market top. History does not repeat itself, but it often rhymes. This line is most often attributed to Mark Twain. The 2000 top formed with two peaks in the 1525-1550 area as the S&P 500 traded sideways from January 2000 to November 2000 (some 11 months). The first breakdown occurred in early October when the index broke below the July low and the long-term trend indicators turned net negative. Notice how the index battled the February-May lows (1325-1350) with a choppy range from October until January. This amounts to four months of trading frustration, but the long-term downtrend never reversed. Instead, the index formed a small triangle and broke down again in February. The S&P 500 became oversold after another double-digit decline to the 1100 area and then bounced back towards the breakdown zone in the 1325-1350 area.
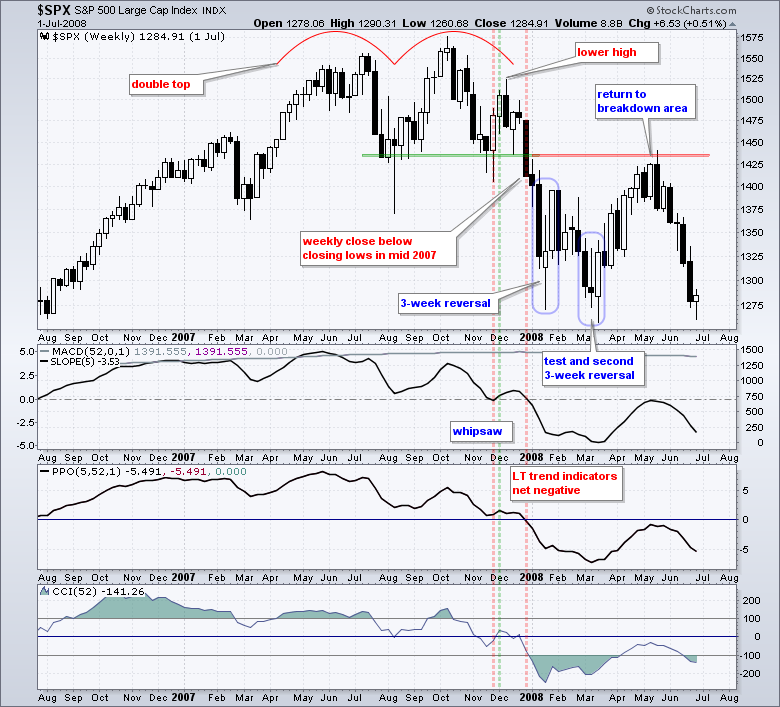
 The 2007 top also formed with two peaks, this time in the 1550-1575 area. Notice that the index traded between 1425 and 1575 from May 2007 to December 2007 as an eight-month top unfolded. The final break came when the index closed below the closing lows from mid 2007. This occurred in December 2007 and the long-term trend indicators also turned negative for the second time in three months. Now, notice the trading from January to March, which was just after the breakdown. There were two 3-week candlestick reversals and lots of choppy price action for three months. It was not a fun time to pick a bottom, but the index eventually managed a counter-trend bounce back to the breakdown zone (1425-1450)
 Here's what we have so far for the 2000 and 2007 tops:
- large Double Top patterns formed
- the topping process took eight to eleven months
- volatility increased after the long-term trend indicators turned net negative
- there was eventually a bounce back to the breakdown zones
Applying Recent History to Current Price Action
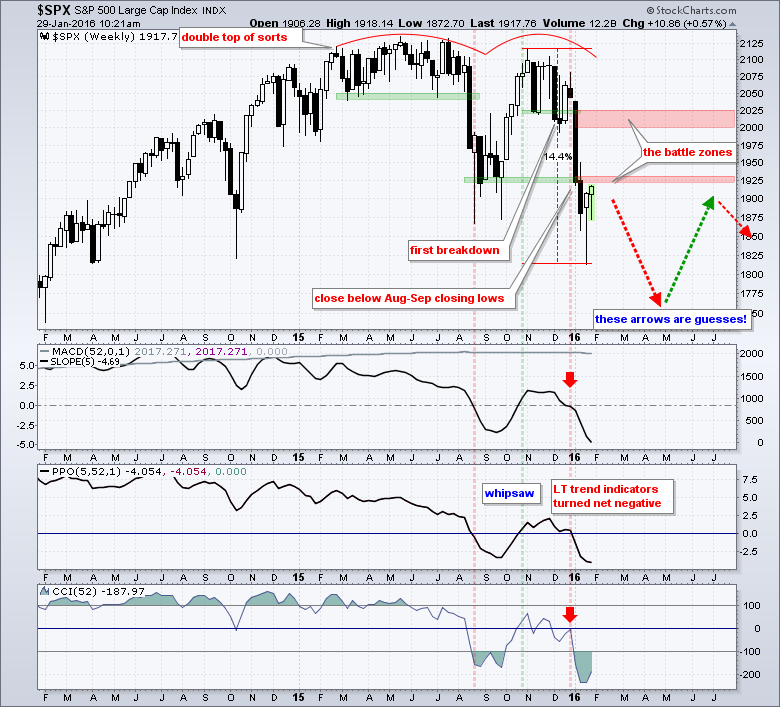
Let's see what we have now. It is not a picture-perfect double top, but the S&P 500 peaked twice in the 2100-2135 area. Overall, the index traded sideways from December 2014 to December 2015 - about a year. The double top was confirmed with a weekly close below the closing lows from August-September. The long-term trend indicators turned net negative at the end of December, which was the second bearish signal in four months. Stocks are trying to firm now, but history suggests that we could be in for choppy price action. This could last months and take place is the 1925 area, which marks the big support break. Even if we get a bounce, I would expect resistance in the 2000-2025 area. Should the S&P 500 continue lower to the 1750-1800 area, look for an eventual bounce back to the breakdown zone around 1925.
Three Positive Characteristics for Utilities
The pickings are slim when stocks are in a bear market. While cash really is a position in a bear market, chartists can use three techniques to find alternatives to stocks and cash. They are trend analysis, relative performance and correlation. Personally, I think we really just need one: trend. Be long in an uptrend. Be out or short in a downtrend. Of course, being short has its risks and is usually much riskier than being long, especially with stocks.
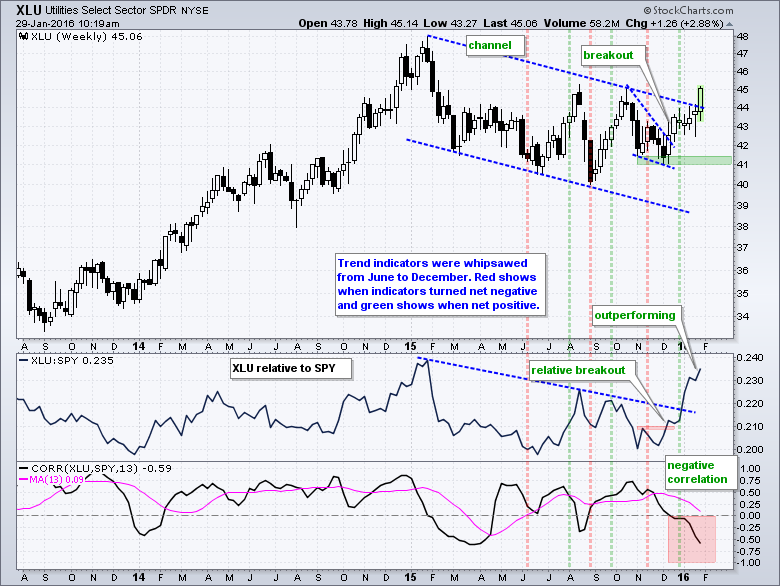
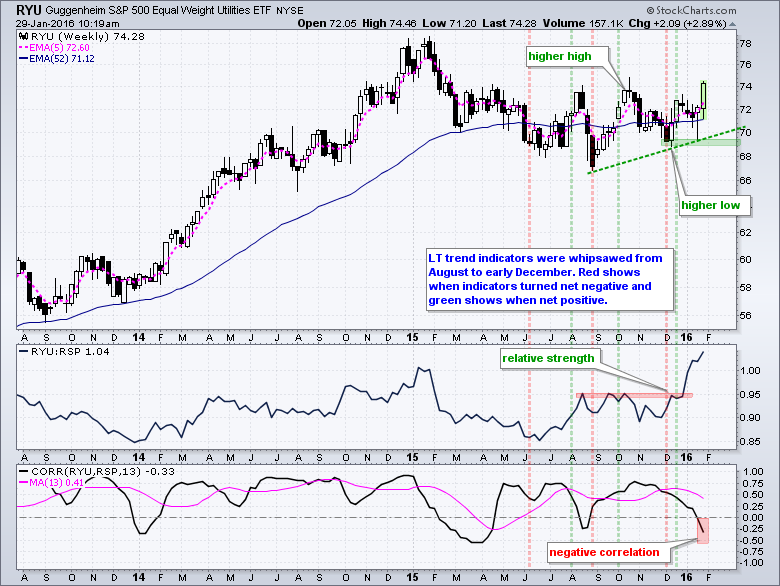
The Utilities SPDR (XLU) is currently in an uptrend, outperforming SPY and showing negative correlation. Notice that the long-term trend indicators were whipsawed from August to November. I think, however, that the trend was down throughout this period because of the falling channel. The ETF did not form a higher low until early December and broke wedge resistance in mid December. The trend indicators turned bullish again in late December. The price relative (XLU:SPY ratio) shows XLU outperforming SPY since late November and the Correlation Coefficient (XLU,SPY) has been negative since mid December. Thus, XLU has everything we want for an alternative to stocks, except for the fact that it is a stock!
Yield Plays Shine
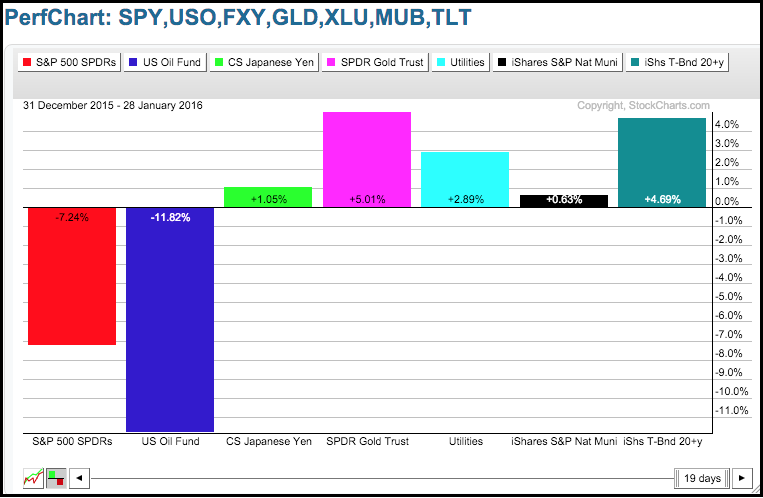
The PerfChart below shows year-to-date performance for stocks, oil, the Yen, gold, utilities, muni-bonds and treasury bonds. Stocks and oil are down sharply, and the other five are up. Gold is up 5% and the 20+ YR T-Bond ETF (TLT) is up 4.69% to lead the pack. As detailed below, I am still not enamored with gold because the long-term trend is down, but the yellow metal could benefit from disruptions in the financial markets. The Yen is taking a hit today and utilities are still stocks, which means they may eventually succumb to broad stock market weakness. TLT and the Municipal Bond ETF (MUB) are the strongest alternatives right now and these two represent safe havens.
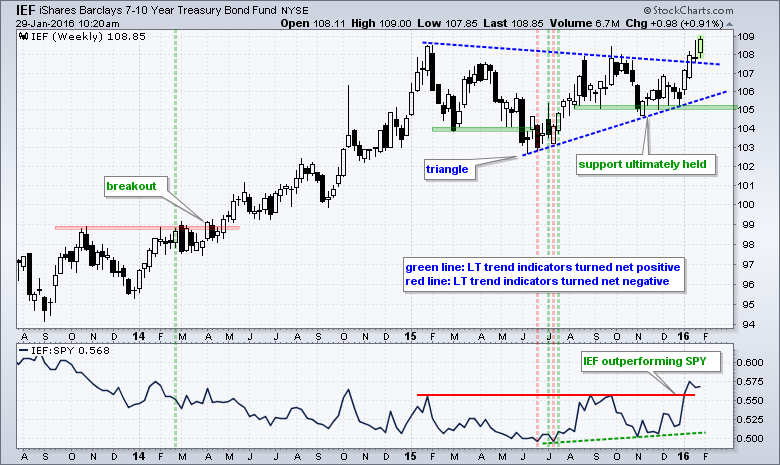
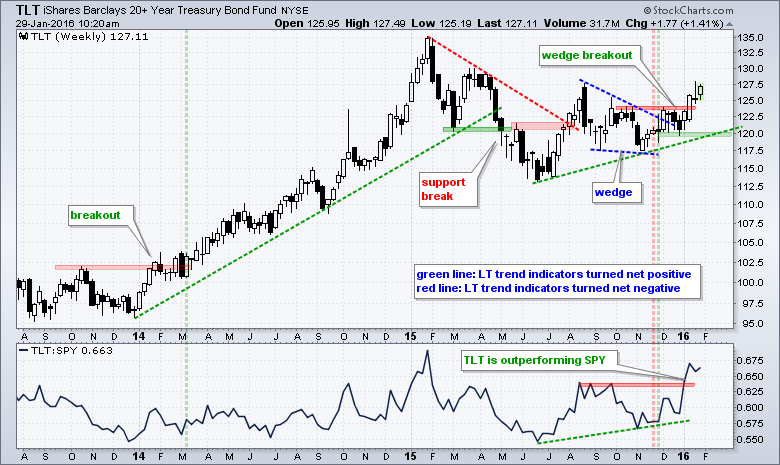
Bonds Gets Extended, but Still Bullish
Just as ETFs can become oversold and get more oversold, they can also become overbought and get more overbought. Typically, we see more oversold readings in downtrends and more overbought readings in uptrends. This makes sense because oversold conditions occur due to strong selling pressure and overbought conditions occur due to strong buying pressure. The 7-10 YR T-Bond ETF (IEF) and the 20+ YR T-Bond ETF (TLT) surged in January and both outperformed the S&P 500 SPDR. After a selloff last week, both resumed their upward trajectory with modest gains so far this week. The trend indicators are bullish for both and the December lows mark key support.
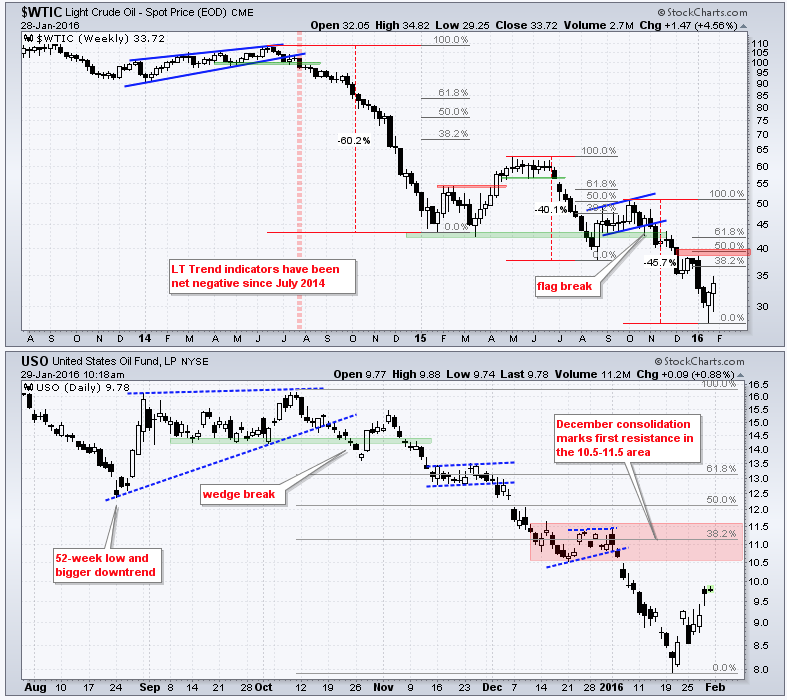
First Target for Oil Bounce
First and foremost, oil is in a long-term downtrend and the current bounce is still considered a counter-trend move. There is no base on this chart, there is no bottoming pattern and there is certainly no uptrend. The weekly chart shows Spot Crude ($WTIC) with three big declines and two retracements. The first counter-trend bounce retraced less than 38% and peaked below 65. The second retraced 50-62% and peaked around 50. Oil fell around 45% from October to January and became oversold several times during the decline. An oversold bounce may now be materializing and I would mark first resistance in the 38-40 area.
Gold Hits Key Retracement Zone
Gold looks to be in a precarious place because the long-term trend is down and the ETF is trading near a key retracement on the daily chart. First and foremost, there is nothing but downtrend on the weekly chart, which is shown on top. GLD has lower lows and lower highs with a 52-week low in December. A break above 115 is needed to reverse the long-term downtrend.
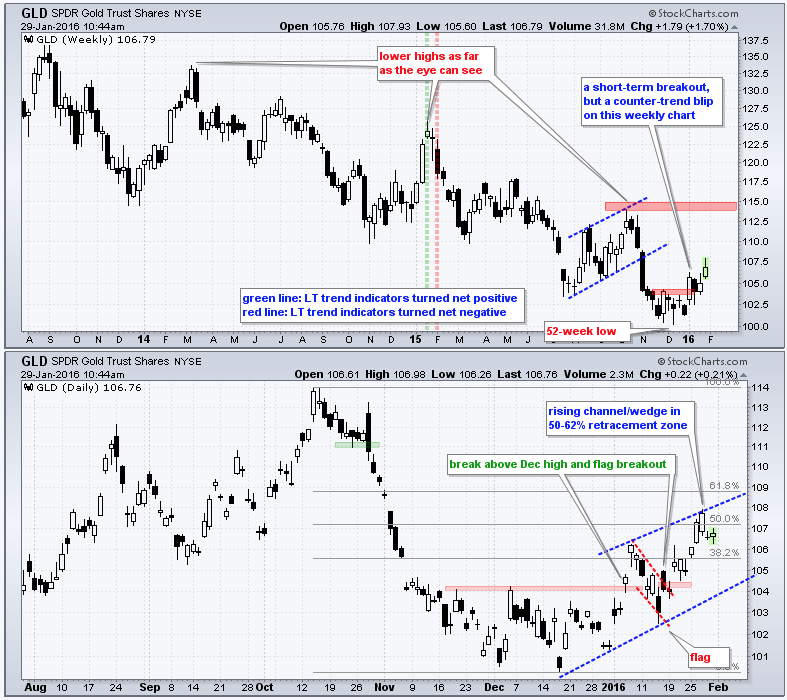 Short-term, GLD got a bounce from mid December to late January as stocks and oil fell rather sharply. This bounce occurred even as the Dollar was flat. Even though this 5% advance looks impressive on the daily chart, it is still a counter-trend blip on the weekly chart. The best short-term buy signal was the flag breakout and this has long passed. GLD is not entering a potential reversal zone as the rising wedge enters the 50-62% retracement zone.
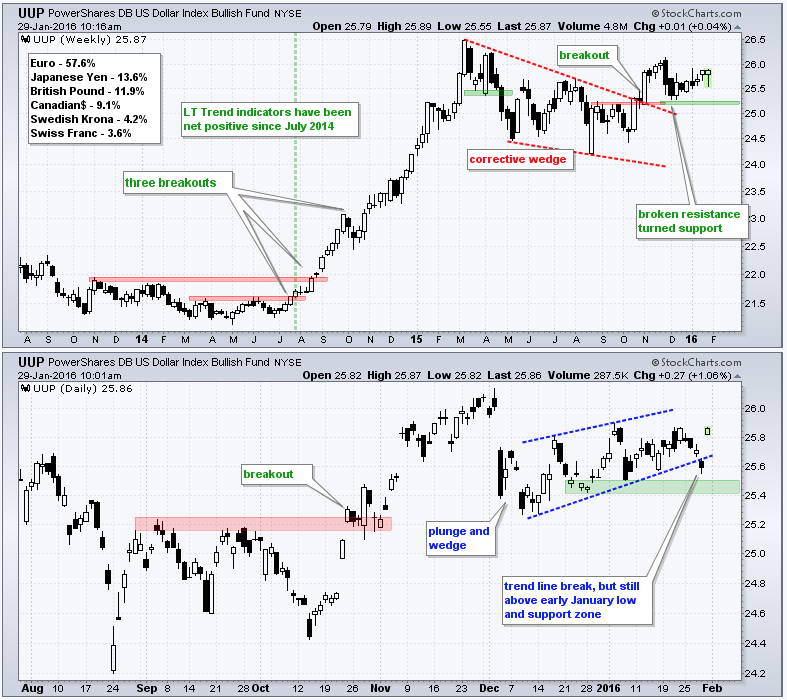
Dollar Holds Breakout
There is no change in the US Dollar ETF (UUP). The wedge breakout in late October remains the dominant chart feature and this is shown on the weekly chart (top). The ETF successfully tested the breakout zone with a pullback in December and bounced over the last seven weeks. Even though the ETF took a hit this week, I would not consider the decline significant unless it breaks the early January low (call it 25.4).
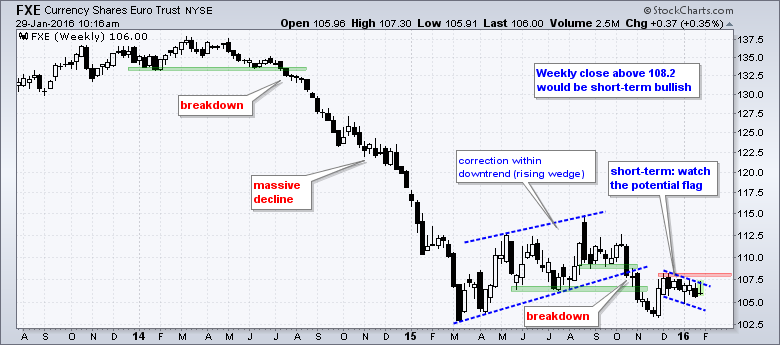
Euro Does not Confirm Flag
One cannot turn bearish on the Dollar without turning bullish on the Euro because its accounts for 57% of the Dollar Index/ETF. I do not see a breakout in the Euro ETF (FXE) yet. The October wedge breakdown is the dominant chart feature and its is bearish. FXE bounced in late November and then formed a potential bull flag, but has yet follow through on this bounce and break out. A break above 108.2 is needed to turn bullish on the Euro and bearish on the greenback.
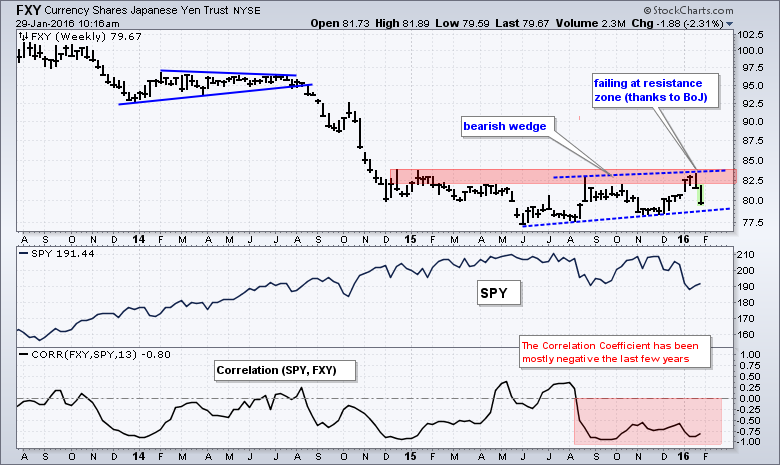
Yen Fails at Resistance
The Yen got hammered today after the Bank of Japan announced negative interest rate policy. Obviously, Japan wants to win this race to the bottom. The Yen ETF (FXY) bounced when the stock market fell sharply in early January, but stalled near resistance and fell back the last two weeks. A rising wedge is taking place and a break below wedge support would signal a continuaiton lower.
Friday Food for Thought
Circularity (Josh Brown, TheReformedBroker.com)
Back to markets and prices – they are the real news, the real story. The most controversial thing Jeff tells the crowd is that oil is not the cause of economic weakness – “It is a symptom. Demand is not there.”
The Case for High Volatility Strategies (econompicdata.blogspot.com)
For one, it certainly makes the case for an allocation to strategies uncorrelated to an existing portfolio that have higher levels of expected volatility. In my opinion, the most obvious strategy that is largely under-allocated to is managed futures and to a lesser extent certain hedge fund styles and (until the last 10 years when everyone piled in)... commodities.
The Unwinding of the "Efficient Capital Structure" Beckons (Tracy Alloway, Bloomberg)
The majority of the new money can be classified as “tourists” aka renters, not owners. As a class, these tourists are unfamiliar with the risks and illiquidity and only familiar with a recent history of strong returns. Similar to the cracks that emerged in late 2007 in the mortgage market, cracks emerged over the past six months in levered credit.
Putting the Hedge Back in Hedge Funds (ThinkAdvisor.com)
There are many strategies within hedge funds, and picking the right strategies for these times can be essential to protect an investment portfolio.
Other Commentary Links
Bear Market Bounces - Understanding Bear Market Patterns, Signals and Retracements.
Measuring Risk On-Risk Off - Using charts to quantify stock, economic and credit risk.
PPO Trading Strategy - How to use 3 PPOs to develop a trend-reversion trading strategy.
Long-term Trend Indicators - Using the PPO, EMA Slope and CCI to determine the trend.
ETF Master ChartPack - 300+ ETFs organized in a Master ChartList and in individual groups.
Follow me on Twitter @arthurhill - Keep up with my 140 character commentaries.
****************************************
Thanks for tuning in and have a good day!
--Arthur Hill CMT
Plan your Trade and Trade your Plan
*****************************************
