SPY Hits Moment of Truth // %Above 20-day EMA Becomes Overbought // Oil is Still in a Downtrend // Reviewing the PPO Strategy // Reconciling the PPO with the Price Chart // Webinar Preview
SPY Hits Moment of Truth
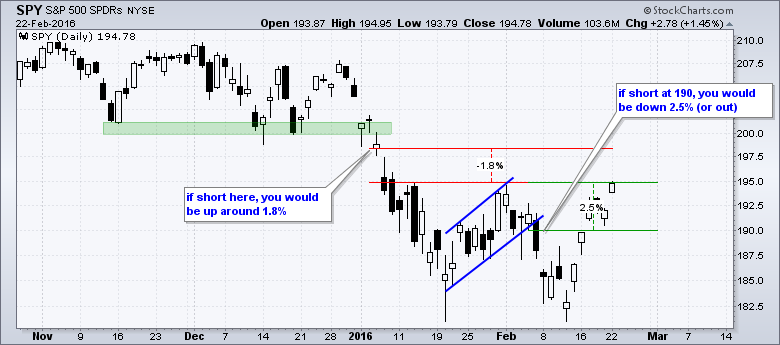
It was another day and another gap as SPY closed at its highest level since early January. Technically, the ETF exceeded its early February high with the sharpest 6-day advance since the third quarter of 2011. This advance continues to impress, but I have yet to get a bullish breath thrust to suggest a long-term reversal. Another day or two of strong breadth could, however, trigger a bullish breadth thrust. Stay tuned. With four gaps in the last six days and a 6+ percent advance in six days, the ETF is getting short-term overbought. Note that SPY spans 7.8% from low to high over the last six days. I realize that overbought is difficult to quantify and SPY could become even more overbought, but I think the ETF is entering a no man's land that will make or break this bear market. Another few days of strong price action would likely trigger a bullish breadth thrust. Conversely, a failure in this area would keep the bear market thesis in play.
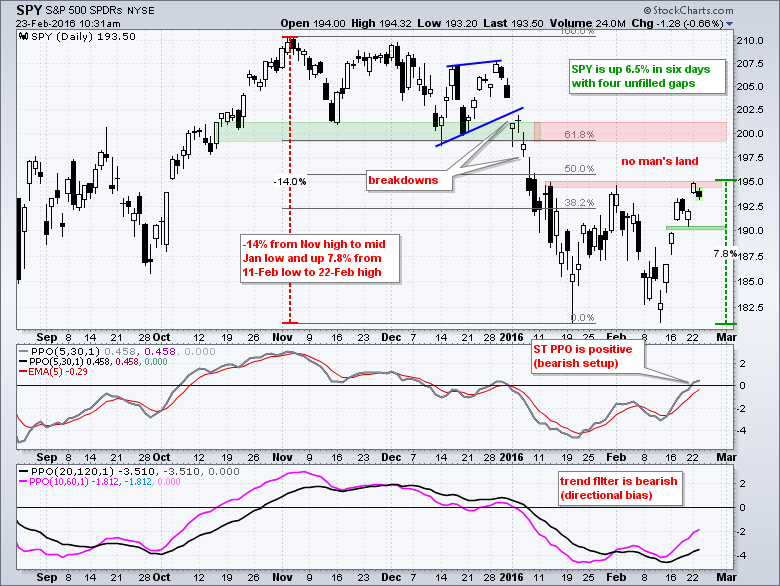
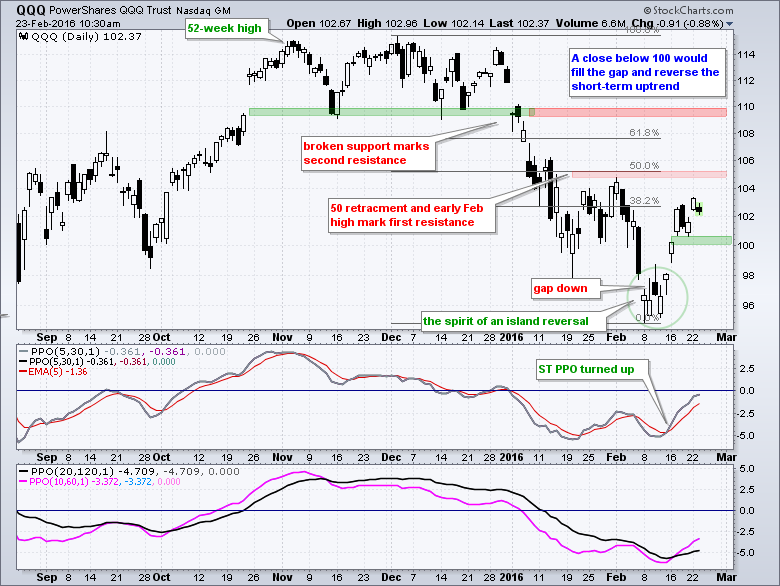
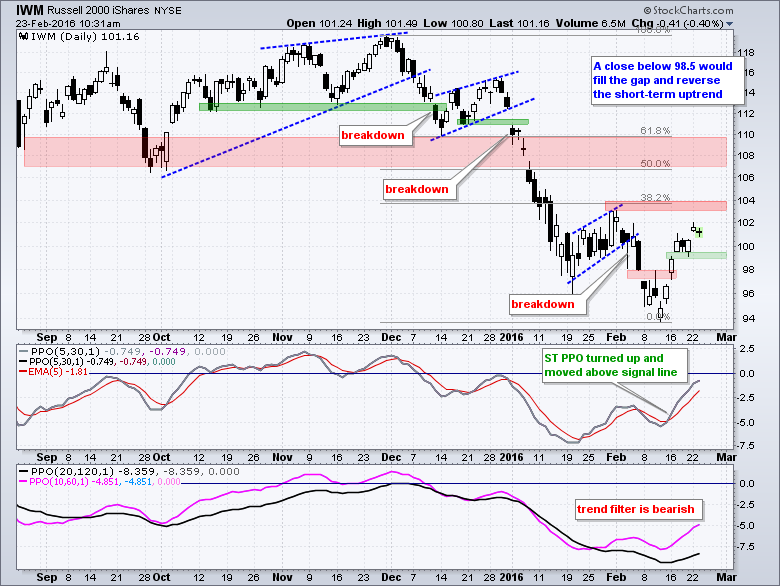
The short-term uptrend holds the first key. It is tempting to use the last gap and mark support at 192 for SPY, but I think this will be too tight. SPY is up sharply and entitled to a pullback or rest so I will give it a little wiggle room. Friday's low and a small buffer mark support at 190. A close below this level would reverse this short-term uptrend. The indicator windows show the PPO strategy in play. Note that I have lots more on the PPO strategy below and in today's webinar. The trend filter is bearish because both the medium-term PPO (10,60,1) and long-term PPO (20,120,1) are negative. This means short-term bearish signals are preferred over bullish signals. The short-term PPO (5,30,5) turned positive and a bearish setup is active. A "setup" means we should be on alert for a reversal, which may or may not happen. A bearish signal would trigger if the PPO moves back below the zero line and/or the PPO moves below its signal line. The short-term levels to watch for QQQ and IWM are unchanged.
%Above 20-day EMA Becomes Overbought
Before we look at this next indicator group, note that short-term trading is difficult and trading the downside is even more difficult. Traders taking short positions in SPY in early January would be up around 1.8%. Traders taking short positions in early February would be showing losses of around 2.5%.
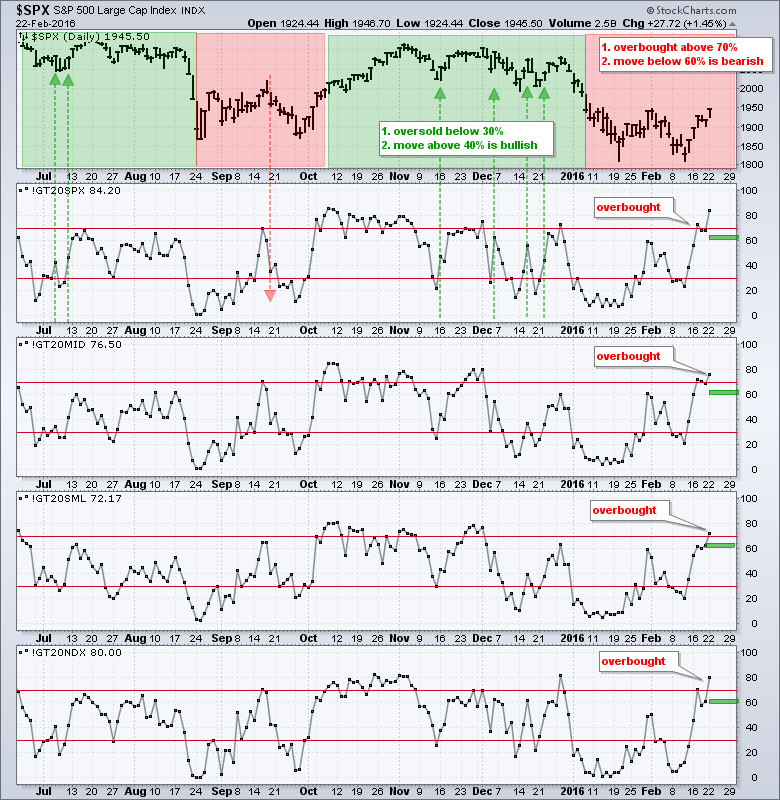
I also use the percentage of stocks above the 20-day EMA to identify short-term overbought conditions and short-term reversals in the major stock indices. During a bull market or long-term uptrend, I look for short-term oversold conditions and a subsequent upturn in the indicator (green shading). During a bear market or long-term downtrend, I look for short-term overbought conditions and a subsequent downturn in the indicator (red shading). After a long bull run from 2012 to 2014, the S&P 500 went through three changes in six months (bear market in August, bull market in October and bear market in January). These changes are shown with the red and green shading on the S&P 500 chart. We are currently in bear mode right now and this means I am looking for short-term overbought conditions and subsequent downturns. The S&P 500 %Above 20-day EMA (!GT20SPX) became overbought with a move above 70% twice in the last four days. Despite being "overbought", the indicator should be considered short-term bullish as long as it remains above 60%. A subsequent move below 60% would show deterioration within the index that could lead to a short-term trend reversal.
Oil is Still in a Downtrend
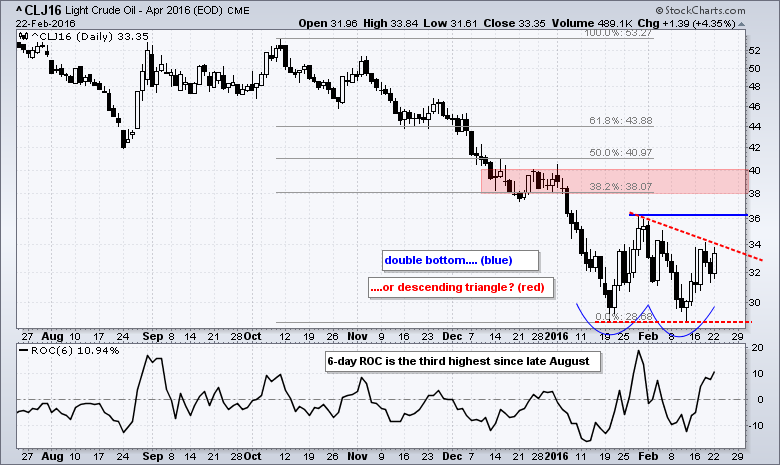
I am not thinking long-term uptrend in oil because crude has yet to exceed its January high. The chart below shows April Light Crude Futures (^CLJ16) with two lows in the 27 area and an 11% bounce the last six days. It is a strong bounce for sure, but oil has yet to even test its prior high and remains in a downtrend overall. A break above this high is required to confirm a double bottom pattern. Barring a breakout, the trend is unequivocally down and a bearish continuation pattern could even form. Should a lower high form in late February, oil would trace out a bearish descending triangle.
Reviewing the PPO Strategy
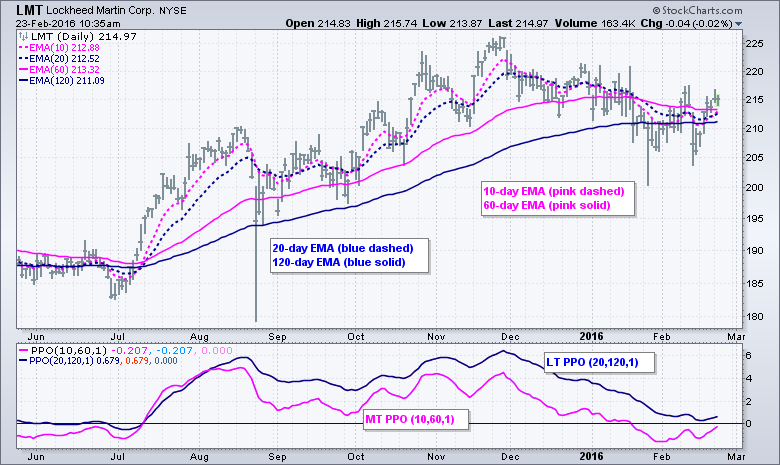
This next section will try to answer a reader question regarding the PPO Strategy. To recap, the Percentage Price Oscillator (PPO) measures the difference between two exponential moving averages. Keep in mind that moving averages are lagging indicators and will turn AFTER price has turned. The PPO is positive when the shorter EMA is above the longer EMA and negative when the shorter EMA is below the longer EMA. I am not using the momentum aspect of the PPO and I ignore divergences. The PPO strategy uses a medium-term PPO (10,60,1) and a long-term PPO (20,120,1) as a trend filter. The medium-term and long-term trends are up when both are positive, and the long-term trend is up when just the PPO (20,120,1) is positive. The chart below shows Lockheed Martin (LMT) with four EMAs and the corresponding PPOs.
This trend filter sets the stage for signals in the short-term PPO (5,30,5). I look for short-term bullish setups when the trend filter is bullish and short-term bearish setups when the trend filter is bearish. Using the short-term PPO (5,30,5), I am looking for a short-term pullback when the trend filter is bullish or a short-term bounce when the trend filter is bearish. A bullish setup occurs when the trend filter is bullish and the short-term PPO (5,30,5) moves below 1 (near the zero line). This means we have seen a short-term pullback or consolidation on the price chart. A subsequent upturn and bullish signal line crossover triggers a bullish signal. I also look for the short-term PPO (5,30,5) to dip below zero and then cross back above the zero line for bullish signals. The opposite can be applied for bearish strategies.
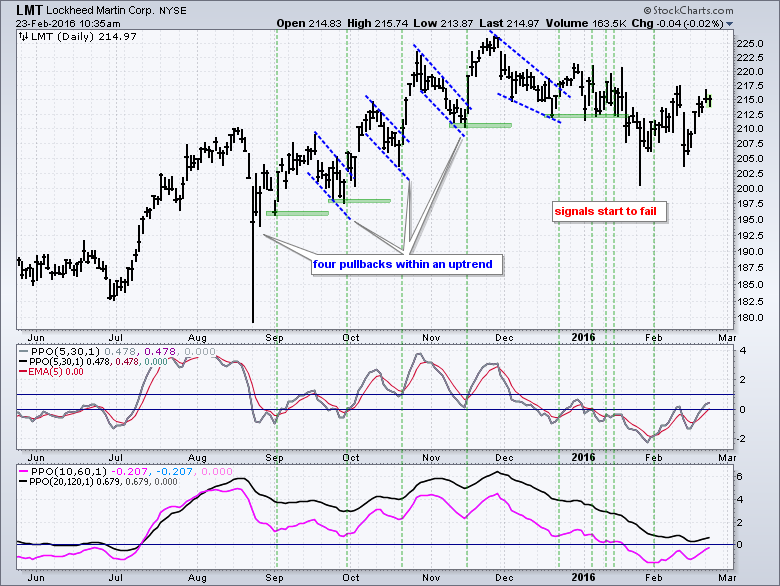
The chart above shows LMT with a clear bullish trend filter from mid July to late January. The PPO (10,60,1) moved below zero in late January, but the PPO (20,120,1) remained positive. Thus, the long-term trend is still up and the three-month decline is viewed as a correction. The vertical green lines show the short-term PPO (5,30,5) signals. These occur when the PPO (5,30,5) moves below 1 to mark a pullback (setup). A subsequent move above the signal line or above the zero line triggers the actual signal. The PPO (5,30,5) identified each pullback from late August to November and the subsequent signals worked out well. The signals stopped working in December and January because LMT moved lower from late November to late January. Note that the stock market moved into bear mode during this timeframe so it is quite normal for bullish signals to stop working.
This PPO strategy is far from perfect and there will be a lot of signals. Chartists need to further filter these signals with further analysis. In addition to basic price chart analysis, chartists should check the broader market situation, sector performance and group performance. I put forth this strategy to show how chartists can use the bigger trend to define the trading bias (bullish or bearish) and then use the shorter trend to time trades.
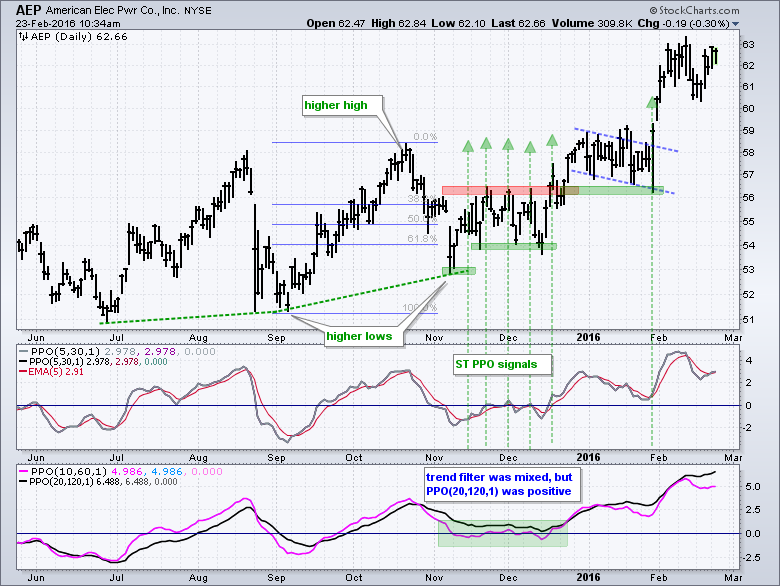
The chart above shows American Electric Power (AEP) with the three Percentage Price Oscillators (PPOs). The medium-term PPO (10,60,1) oscillated around the zero line from mid November to mid December and the long-term PPO (20,120,1) held above the zero line. On the price chart, the stock formed a higher low in late August and another higher low in November. Combined with a higher high in October, it looked like an uptrend was underway on the price chart. The short-term PPO (5,30,1) triggered at least five bullish signals from mid November to mid December and another one in late January.
Reconciling the PPO with the Price Chart
My short recap turned into a long explanation but I hope it helped with the understanding. A reader notes that the medium-term PPO (10,60,1) and long-term PPO (20,120,1) sometimes turn negative when a stock declines and retraces 50% to 61.8% of a prior advance. Thus, we have a conundrum because the trend indicators point to a downtrend, but the price chart suggests it is just a correction that could end soon. How do I reconcile this discrepancy? The PPO Strategy is designed to identify short-term pullbacks within a bigger uptrend (or bounces within a bigger downtrend). It really is a short-term system that is dependent on a fixed time scale. The PPO signals will sometimes jibe with the price chart and sometimes they won't.
The PPO has a time-based parameter that ties it to a specific time period. It is designed to catch short-term pullbacks within a bigger uptrend and short-term bounces within a bigger downtrend. The medium-term PPO (10,60,1) will be positive as long as the 10-day EMA stays above the 60-day EMA. In theory, a sharp 10-day decline could turn this PPO negative. Similarly, the long-term PPO (20,120,1) will be positive as long as the 20-day EMA is above the 120-day EMA. In theory, a sharp 20-day decline could turn this PPO negative. In general, once a decline extends two or more months, we will most likely see the medium-term PPO (10,60,1) turn negative. Anything longer than three montsh will likely turn the long-term PPO (20,120,1).
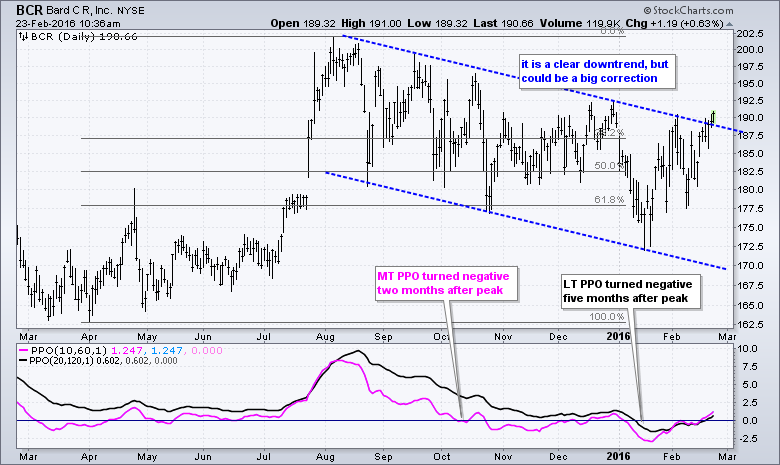
Negative turns in the PPO do not tell us where prices are relative to their prior high and prior low. For that we have to look at the actual price chart. Thus, it is perfectly possible to have the medium-term PPO (10,60,1) and long-term PPO (20,120,1) negative when a decline has retraced 50% to 61.8% of the prior advance, especially if that decline extends more than two months.
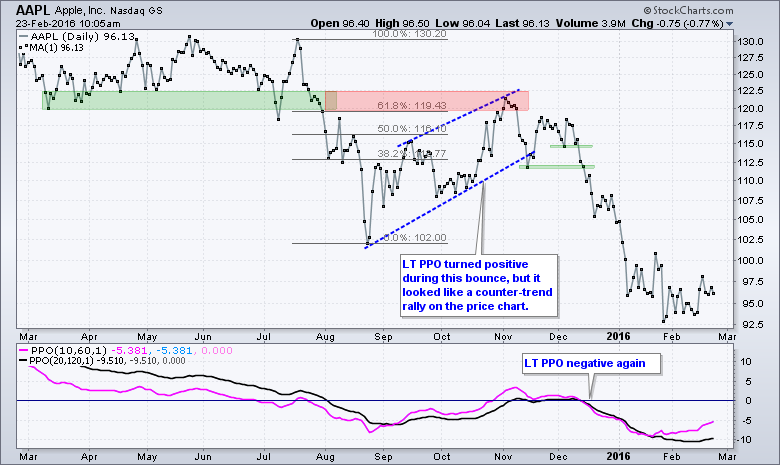
The chart above shows Apple for a reverse example. Notice how the stock broke down in late July and fell sharply into August. The bounce from late August to early November was enough to turn the medium-term PPO and long-term PPO positive, but this advance looked like a counter-trend move on the price chart. Notice that a rising channel formed, the advance retraced around 61.8% of the prior decline and the move returned to broken support. These are all hallmarks of a counter-trend advance. The stock started breaking down in mid November and clearly broke support in mid December. Both PPOs also moved into negative territory in mid December.
As far as I am concerned, the price chart carries more weight than any indicator. Indicators are good for quantifying price action and scanning to narrow a watch list. The PPO is based on moving averages and signals will sometimes lag what we are seeing on the price chart. The PPO will catch up if the trend persists, but may not trigger a signal if the trend fails. Any failure, however, would be visible on the actual price chart and I base my trades on price levels, not indicator levels. In other words, the indicator just provides an indication and the price chart is the final arbiter.
Other Commentary Links
Bear Market Bounces - Understanding Bear Market Patterns, Signals and Retracements.
Measuring Risk On-Risk Off - Using charts to quantify stock, economic and credit risk.
PPO Trading Strategy - How to use 3 PPOs to develop a trend-reversion trading strategy.
Long-term Trend Indicators - Using the PPO, EMA Slope and CCI to determine the trend.
ETF Master ChartPack - 300+ ETFs organized in a Master ChartList and in individual groups.
Follow me on Twitter @arthurhill - Keep up with my 140 character commentaries.
****************************************
Thanks for tuning in and have a good day!
--Arthur Hill CMT
Plan your Trade and Trade your Plan
*****************************************
