Putting the Pullback into Perspective // Breadth Softens, but Bullish Signals Remain // New Highs Dwindle, but Stay Net Positive // The Key Level for SPY is Obvious // A Battle Zone Brews for IWM // A Bull Flag for QQQ? //// .......
Putting the Pullback into Perspective
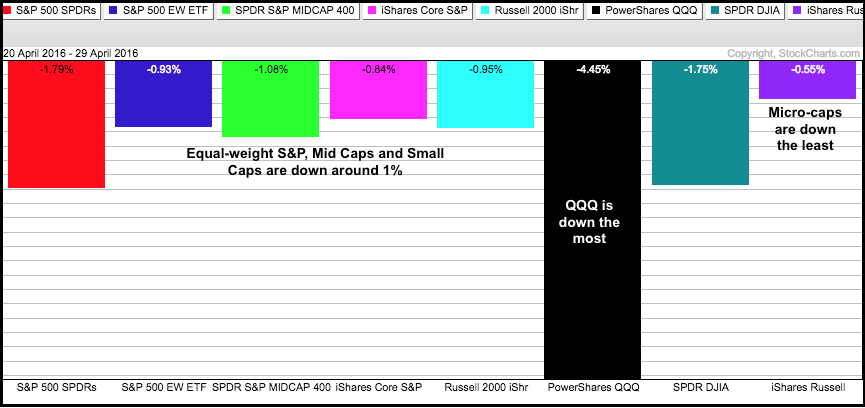
The Nasdaq 100 ETF led the market lower with a sharp decline the last eight trading days. And, as noted on Friday, we are seeing relative weakness in the EW Technology ETF, the Retail SPDR and the EW Consumer Discretionary ETF. Is this enough to turn bearish on the market as a whole? At this point, I am still treating current weakness as a correction within a bigger uptrend. Keep in mind that the S&P 500 SPDR surged around 13% from mid February to mid April and hit an all time high on April 20th, seven trading days ago. Stocks are entitled to a corrective period after such a sharp advance. Even with the current decline, SPY is still around 2% from its closing high and shows more strength than weakness. The PerfChart below shows just how far the major index ETFs fell with the recent pullback. It ain't much.
There are some concerns with the six month seasonal pattern because it turned less bullish this month. As noted on Tuesday and Friday, I found that October is a pivotal month for the S&P 500 and the most bullish period actually extends from October to April (seven months instead of six). Since 1950, the S&P 500 averages a 7.5% annual return for these seven months. The other period, five months from May to September, had an average annual return of -.11%, which is basically flat. Also note that the six month period from May to October had an average annual return of +1%. Historically, the next few months have been challenging for the stock market, but not really bearish because the historical data is flat at worst.
Breadth Softens, but Bullish Signals Remain
There were bullish signals in early March and these bullish signals have yet to be negated with bearish signals. Seasonality is interesting, but I put more weight in breadth and price signals. In particular, we saw price breakouts for SPY, QQQ and IWM in late February. A breadth thrust triggered on March 3rd and High-Low Percent triggered in late March. Signals and trends are considered in place until proven otherwise so let's look at the breadth indicators to see what it would take to turn bearish on the market as a whole.
First, we have the 10-day EMA for AD Percent for the S&P 1500, S&P 500, S&P MidCap 400, S&P Small-Cap 600 and Nasdaq 100. I typically use the S&P 1500 for broad market breadth signals and then break it down for more nuance. It has been a rather wild ride since August with four signals in the last nine months. The red/green dotted lines show the signals for the S&P 1500, while the red/green arrows show the signals for each index. The current bullish signal (March 3rd) remains in effect until there is enough selling pressure for a bearish signal (below -30%). I am not looking at divergences here and will stay bullish until there is a material increase in actual selling pressure. Notice that the indicators are just below the zero line right now. This means we have seen relatively flat breadth over the last two weeks. It would take another 1-2 weeks of good selling pressure to trigger bearish signals.

New Highs Dwindle, but Stay Net Positive
The next chart shows High-Low Percent for the same indexes. Again, I use the S&P 1500 for broad market signals and break it down for further nuance. A bullish signal triggers with a move above +10% and remains bullish until a move below -10%. High-Low Percent for the S&P 1500, S&P 500 and S&P MidCap 400 triggered bullish signals in March, but High-Low Percent for the S&P Small-Cap 600 and Nasdaq 100 did not. This is a non-confirmation of sorts, but the three bullish signals still outnumber the two non-confirmations. This indicator remains bullish until S&P 1500 High-Low Percent ($SUPHLP) moves below -10% or three of the five move below -10%. Those looking for an earlier signal can use the -5% level. There is some concern that new highs have dwindled over the last two weeks. This is normal because we have had a correction and the previous new high leaders stumbles (utilities and consumer staples).

The breadth indicators have softened over the last few weeks, but the bullish signals have yet to be negated. SPY hit a new high less than two weeks ago and small-caps are showing relative strength since mid February. All big declines start as small declines, but not all corrections turn into major trend reversals. I have to make an assumption at some point and I think the overall environment is still bullish for stocks. This means short-term declines are viewed as corrections and we should still be looking for bullish setups, not bearish setups.
The Key Level for SPY is Obvious
The first chart shows SPY pulling back to the gap zone and forming an indecisive candlestick on Friday. This gap zone marks the first support level to watch. Longer term, the Raff Regression Channel, April lows and 200-day moving average mark key support in the 200-203 area. Support levels don't get much clearer than this. A close below 200 would call for a reassessment.

IWM Gears up for a Battle
IWM pulled back over the last two days and held up much better than SPY, which pulled back over the last seven days. A little relative strength in small-caps is positive overall. Also note that IWM moved above its 200-day in April and remains above this key average. Admittedly, the area around the falling 200-day could mark a battle zone. While a break back below the 200-day would be negative, it would still be within the context of an overall uptrend. I am marking key support at 108 and will not reassess my bullish stance until a close below this level.

A Bull Flag for QQQ?
QQQ broke below its support zone, but IWM and SPY have yet to break support. The majority is still bullish. Even with QQQ, I view this as a correction because the broad market environment is bullish. QQQ has a potential flag working the last two weeks with short-term resistance set at 108. The PPO (5,30,1) moved below zero and this is a bullish setup because it signals a correction. A bullish trigger would occur if/when the PPO moves back above the zero line.

******************************************************
Measuring Risk On-Risk Off - Using charts to quantify stock, economic and credit risk.
PPO Trading Strategy - How to use 3 PPOs to develop a trend-reversion trading strategy.
Long-term Trend Indicators - Using the PPO, EMA Slope and CCI to determine the trend.
ETF Master ChartPack - 300+ ETFs organized in a Master ChartList and in individual groups.
Follow me on Twitter @arthurhill - Keep up with my 140 character commentaries.
****************************************
Thanks for tuning in and have a good day!
--Arthur Hill CMT
Plan your Trade and Trade your Plan
*****************************************
