SPY Volatility Expansion is Bullish // High-Low Lines Turn Back Up // Mid-caps Lead New High List // Sectors Reflect Broad Market Strength // Consumer Discretionary is the Only Weak Link // EW Technology ETF Challenges Highs // Staples and Utilities Stall within Uptrends // Friday Food For Thought //// ....
SPY Volatility Expansion is Bullish
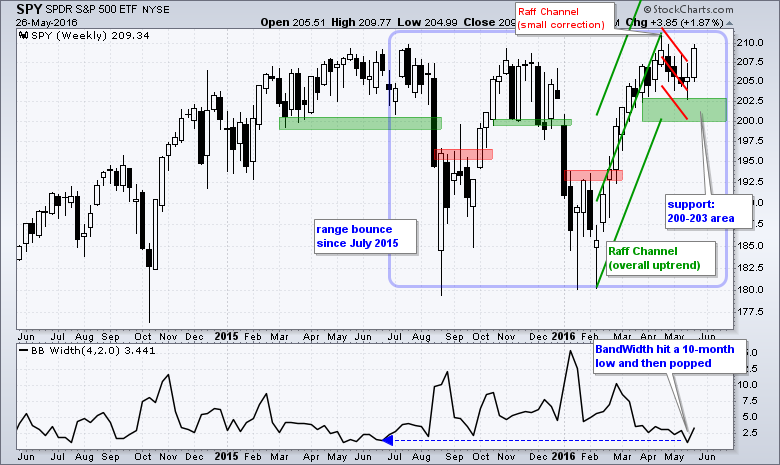
Last Friday I showed a weekly chart for SPY with the BandWidth indicator hitting its lowest level since June. Low BandWidth signaled a volatility contraction on the price chart and indicated that we should prepare for a volatility expansion. Well, we got a volatility expansion this week as SPY surged to its highest level of the month and broke the Raff Regression Channel. The breakout and volatility expansion are bullish until proven otherwise. Actually, SPY was already in bull mode. This breakout simply signals an end to the correction and a resumption of the overall uptrend. I will leave key support in the 200-203 area for now.
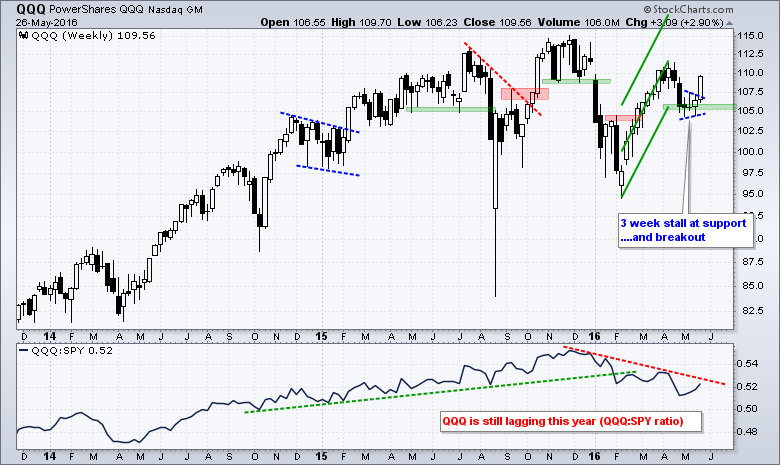
QQQ was most impressive this week with a successful support test and a consolidation breakout. This breakout affirms support in the 105-106 area and keeps the uptrend alive. Note that this uptrend began with the late February breakout. Even though QQQ is lagging SPY since December, I view this breakout as bullish and would expect a challenge to the 2015 highs. A close below 105 would call for a reassessment.
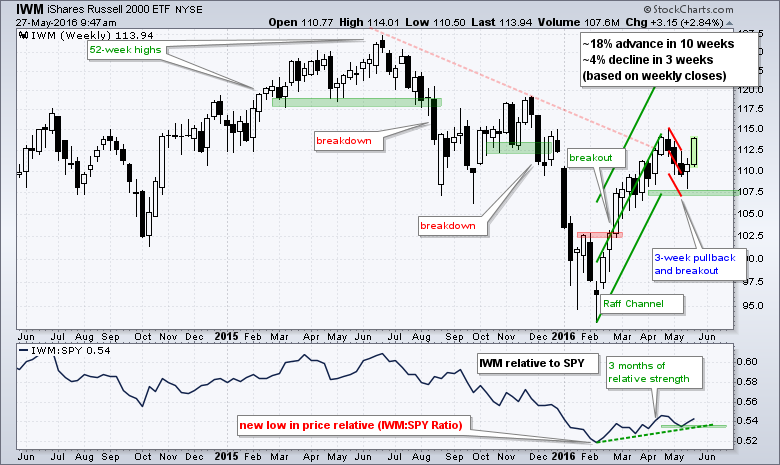
IWM pulled back for three weeks, firmed last week and surged this week. On a closing basis, we have a 3-week pullback (~4%) after a 10-week advance (~18%). Pullback are normal in uptrends and this pullback was rather tame. This week's breakout signals an end to the pullback and a resumption of the bigger uptrend, which began with the February breakout.
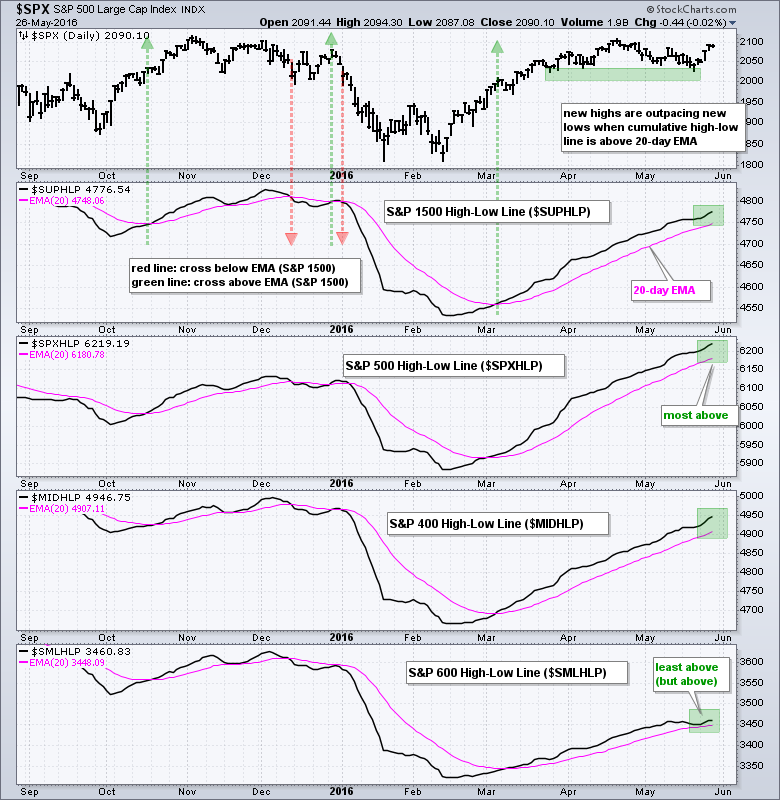
High-Low Lines Turn Back Up
The High-Low Lines for the S&P 1500, S&P 500, S&P MidCap 400 and S&P Small-Cap 600 extended their current uptrends and remain above their 20-day EMAs. Note that these lines have been above their 20-day EMAs since early March. It is quite simple. The bulls have the edge as long as new highs outpace new lows, which is what happens when the High-Low Lines rise. The S&P SmallCap High-Low Line ($SMLHLP) is the least strong of the group, but still rising and still bullish overall.
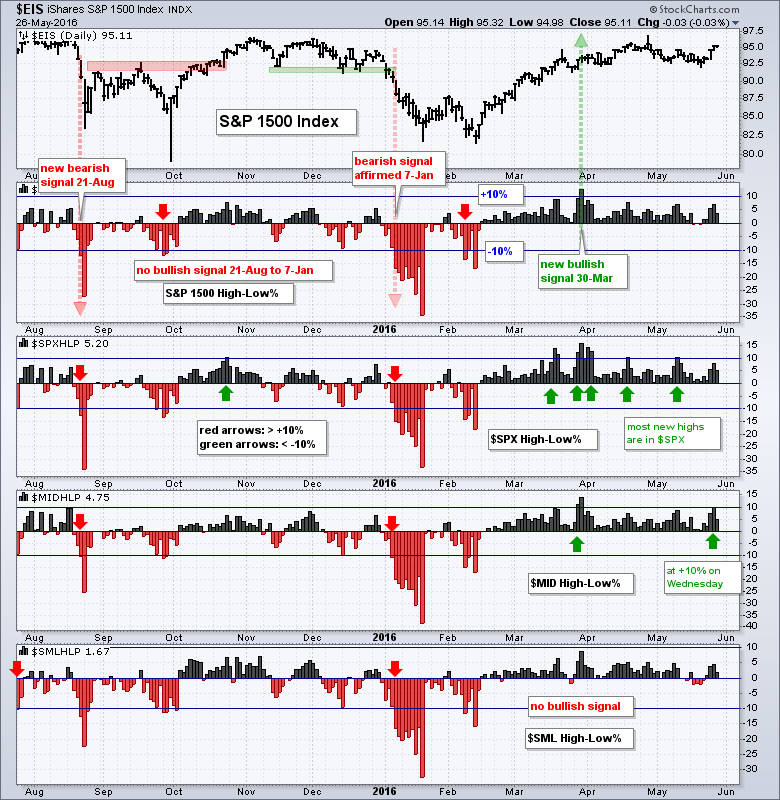
Mid-caps Lead New High List
The next chart shows High-Low Percent for the same indexes and S&P 400 HiLo% ($MIDHLP) is leading with a move to +10% this week. The bullish threshold is at +10% and the bearish threshold at -10%. I use S&P 1500 High-Low Percent ($SUPHLP) as the most important barometer and then break the index down ($SPX, $MID, $SML). S&P 1500 High-Low Percent has been bullish since March 30th. Notice that the most green arrows (> +10%) can be found in S&P 500 HiLo% ($SPXHLP), which means large-caps are dominating the new high list right now. Mid-caps made a move this week as S&P MidCap High-Low Percent hit +10% on Wednesday. The S&P 600 HiLo% ($SMLHLP) has yet to reverse its bearish signal from late July with a move above +10%.
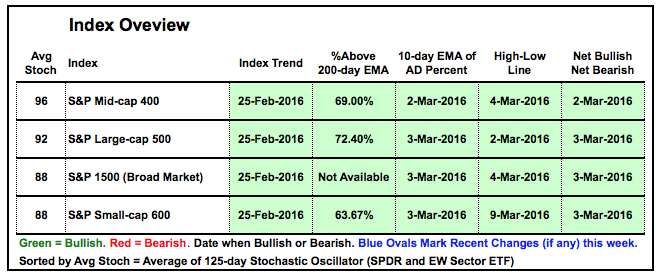
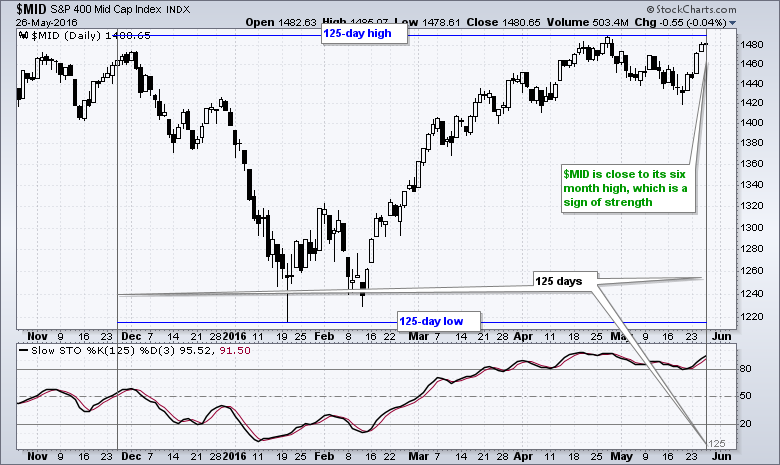
The table below sums up the breadth and trend signals for the major indexes. I added the 125-day Stochastic Oscillator for ranking purposes. This indicator shows the level of the close relative to the high-low range over the last 125 days (~six months). The index is close to its six month high when above 90 and close to a six month low when below 10. The S&P MidCap 400 has the strongest chart because it is the closest to its six month high.
Sectors Reflect Broad Market Strength
The sector breadth and trend indicators support the broad market uptrend. Note that I use this table to breakdown the market and further my weight-of-the-evidence approach for the broader market trend, which is THE most important consideration. There are only two spots of weakness and they can be found in the consumer discretionary.
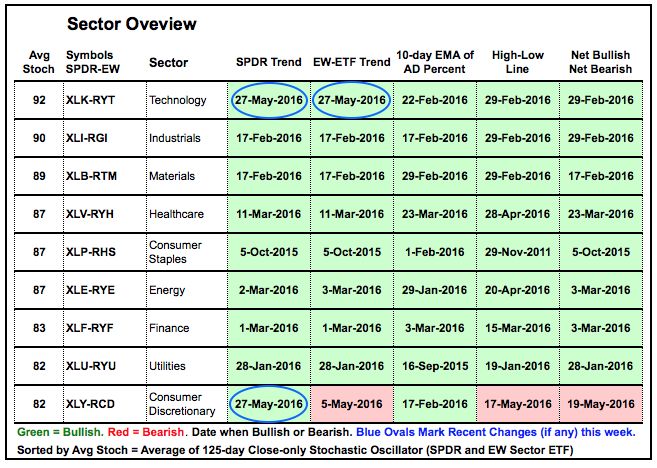
Note that this table is sorted by the average of the Stochastic Oscillator for the SPDR and the equal-weight ETF. I added this sort to better reflect overall chart strength and recent chart weakness in the utilities and consumer discretionary sectors. The utilities ETFs are off their highs, but still in uptrends and the sector is still net bullish.
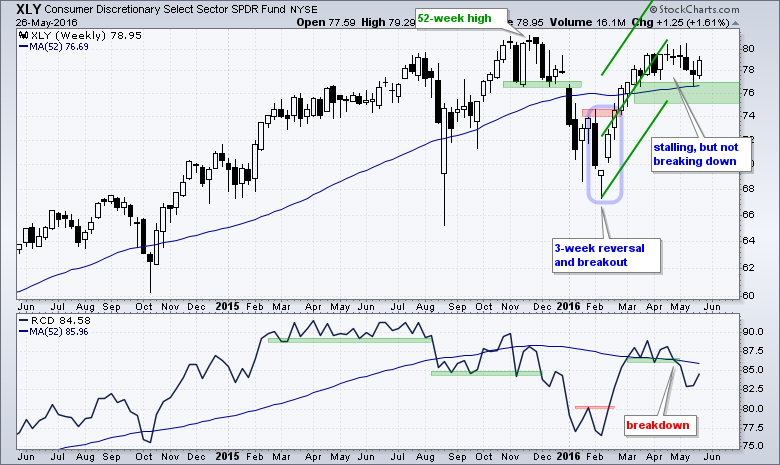
Consumer Discretionary is the Only Weak Link
The next charts show the sector SPDR in the main window and the equal-weight sector ETF in the lower window for reference. I added a 52-week moving average as a "benchmark" level that we can use to compare the sectors. All nine sector SPDRs are above their 52-week SMAs and eight of the nine equal-weight sectors are above their 52-week SMAs. The EW Consumer Discretionary ETF (RCD) is the only sector below this moving average. All nine sector SPDRs are in uptrends since with the green support zones marking the first level to watch.
The Consumer Discretionary SPDR (XLY) stalled in the 78-80 area for the last two months, but has yet to break down (thanks to Amazon). Because of the steep advance, I am using the Raff Regression Channel to mark support in the 75-77 area. The EW Consumer Discretionary ETF (RCD) broke down in April and remains in a downtrend.
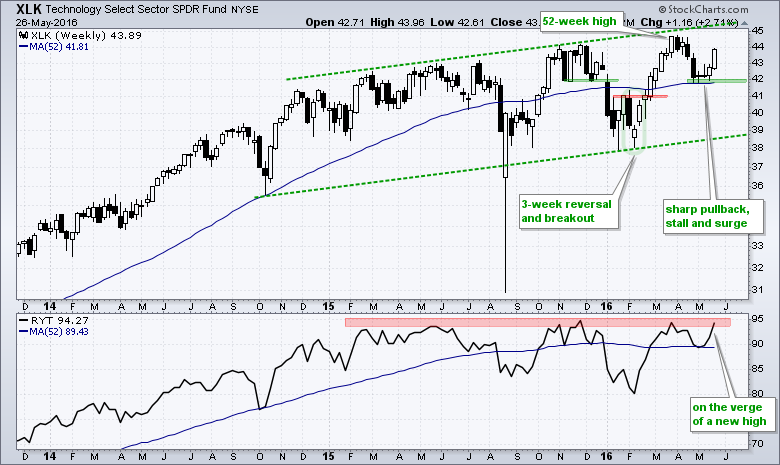
EW Technology ETF Challenges Highs
The Technology SPDR (XLK) remains in a long-term uptrend via the rising price channel. The ETF broke down in late April, but immediately firmed and surged over the last two weeks. Looks like the long-term uptrend has pulled trump. The EW Technology ETF (RYT) is challenging its prior highs.
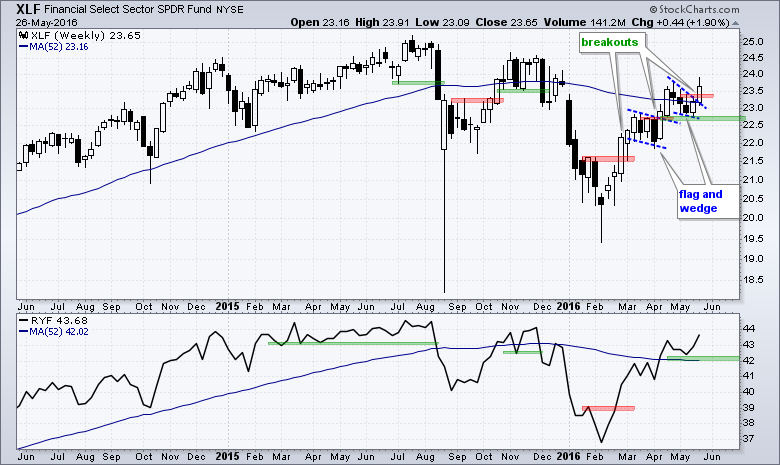
The Finance SPDR (XLF) broke wedge resistance with a surge this week and I am now raising support to the May low. The EW Finance ETF (RYF) also surged and hit a new high for the year (2016) this week. No signs of weakness in the finance sector.
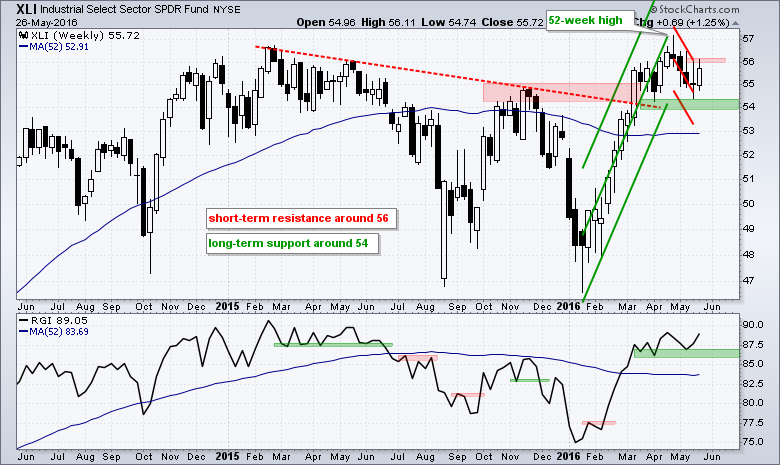
The Industrials SPDR (XLI) hit a new high in April and pulled back in May. The green Raff Regression Channel marks support in the 54 area for the big uptrend. The red Raff Regression Channel marks resistance in the 56 area for the pullback. The EW Industrials ETF (RGI) bounced and held support in the 86-87 area.
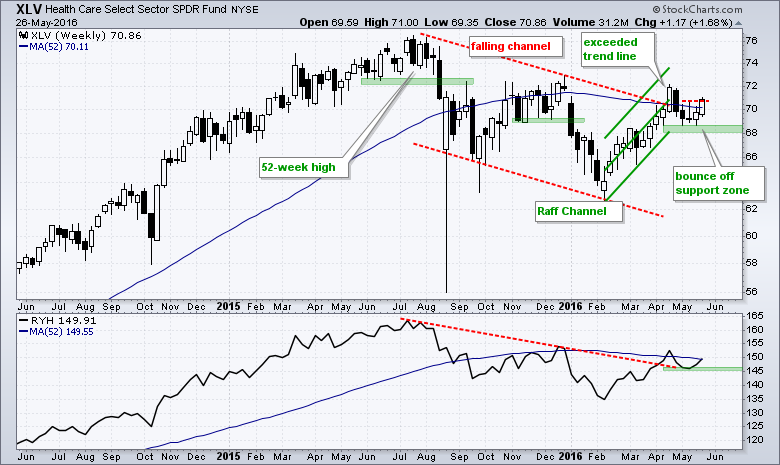
The HealthCare SPDR (XLV) is not the strongest SPDR, but it is contributing to the market overall. XLV broke the red channel trend line with a surge to 72 in mid April. The ETF then pulled back below 70, firmed near the support zone and surged this week. The Raff Regression Channel and May lows mark support in the 68-69 area. The EW Healthcare ETF (RYH) also turned up and I am marking support at 145.
Staples and Utilities Stall within Uptrends
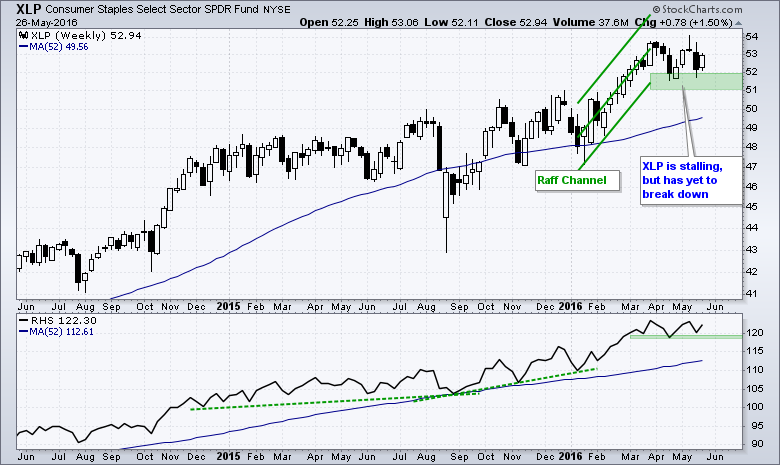
The Consumer Staples SPDR (XLP) stalled the last two months, but has yet to break down and remains in an uptrend overall. Even though this stalling could be a topping pattern, it would not be confirmed as bearish until a support break at 51. The EW Consumer Staples ETF (RHS) is also stalling at a relatively high level.
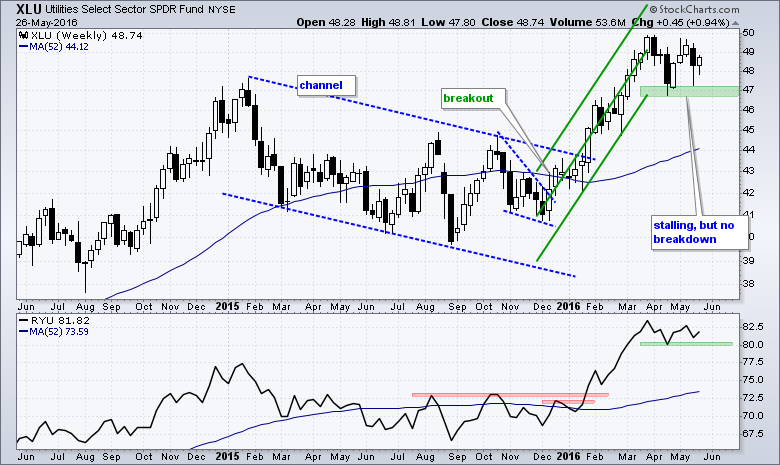
The Utilities SPDR (XLU) looks similar to the Consumer Staples SPDR because it is also stalling within an uptrend. The Raff Regression Channel and April low mark support in the 47 area. The EW Utilities ETF (RYU) has support around 80.
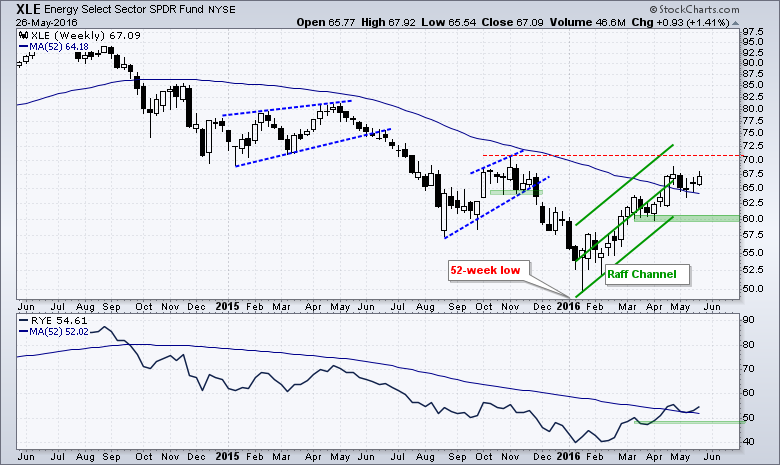
One could still make the argument for a long-term downtrend in the Energy SPDR (XLE), but the five month trend is clearly up and quite strong. This is the most important trend and I am marking support at 60 for now. I realize support is a bit far, but do not see a plausible alternative right now. The EW Energy ETF (RYE) has support in the 48 area.
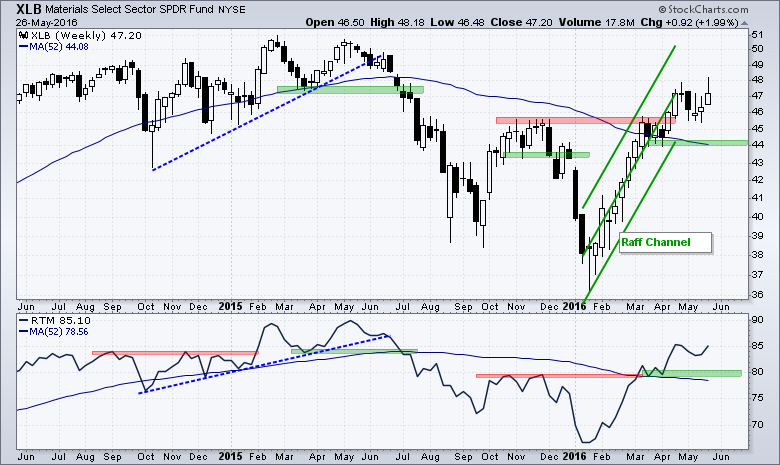
The Materials SPDR (XLB) broke above its November highs and has outperformed XLE in that regard. The current uptrend is steep with the Raff Regression Channel marking support in the 44 area. The EW Materials ETF (RTM) has support in the 79-80 area.
Friday Food For Thought
Never Sell A Dull Market (Jon Markman)
The trouble with the current market environment overall is there’s been a whole bunch of these 1% up days and 1% down days … but net-net the market has gone nowhere over the past 18 months, as shown in our first chart.
Gap Mulls Selling on Amazon (L2 Inc)
Gap plans to salvage dismal sales by partnering with e-tailers like Amazon, but the brand should also leverage its own retail footprint. “To not be considering Amazon and others would be — in my view — delusional,” CEO Art Peck said at the company’s annual investor meeting on Tuesday.
A Comprehensive Guide to ETFs (CFA Institute)
This is a 181 page PDF file packed with info.
THE GREAT BOND SELL-OFF OF 2015: REPEATING IN 2016? (LPL Research)
The trajectory of high-quality bond yields so far in 2016 is looking eerily similar to 2015, when a second quarter bond sell-off caught investors by surprise. Differences are present but a simple chart (lagging the 2016 data by just 10 days) illustrates how Treasury yields may be taking the same course in 2016 as in 2015
A Candid Discussion with an Algorithmic Trader (QuantInsti)
The role of Algorithm in a person’s life is too substantial to be ignored. From a simple coffee-making machine to the music system in his car, from elevators to search engine like Google, all are governed by a set of logical instructions – Algorithms or Algos, which enable them to respond to a person’s specific requirement.
******************************************************
Measuring Risk On-Risk Off - Using charts to quantify stock, economic and credit risk.
PPO Trading Strategy - How to use 3 PPOs to develop a trend-reversion trading strategy.
Long-term Trend Indicators - Using the PPO, EMA Slope and CCI to determine the trend.
ETF Master ChartPack - 300+ ETFs organized in a Master ChartList and in individual groups.
Follow me on Twitter @arthurhill - Keep up with my 140 character commentaries.
****************************************
Thanks for tuning in and have a good day!
--Arthur Hill CMT
Plan your Trade and Trade your Plan
*****************************************
