Mixed Up May as Tech offsets Finance // Mild Correction Extends for SPY // QQQ Reflects Strength in Tech // Watching Bonds for Clues on Risk Appetite // Adding an Exit Strategy to the PPO Signals // Watching Regional Banks, Semis and Homebuilders // Finance Sector Fails to Pop // SKYY and IGV Show Relative Strength //// ...........
Mixed Up May as Tech offsets Finance
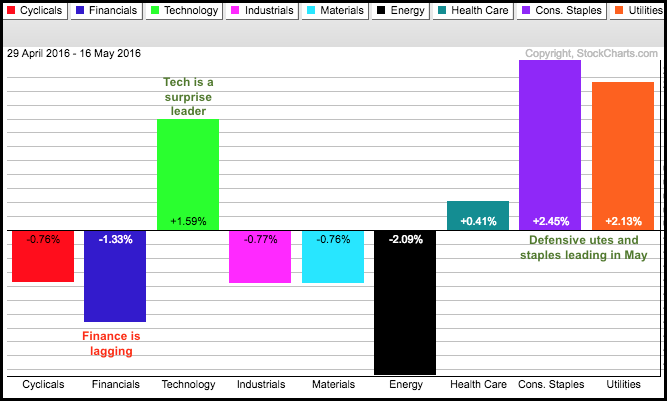
Sector performance this month has been quite mixed with four up and five down. SPY reflects this division with a fractional gain so far this month. The defensive sectors are leading this month with utilities and consumer staples up more than 2%, and healthcare is up a fraction. Of note, the Technology SPDR (XLK) is leading month-to-date with a 1.6% gain. On the other side, the Finance SPDR (XLF) has been the biggest drain on the broader market with a 1.33% loss this month. The Energy SPDR (XLE) is down 2%, but this sector only accounts for 7.11% of SPY. The finance sector accounts for 16% and has a much bigger influence on the broader market.
Mild Correction Extends for SPY
Overall, I continue to work under the assumption that the decline over the last four weeks is a correction within a bigger uptrend. The reasons for the bigger uptrend are detailed in Friday's commentary (price action, breadth, sector participation). The assessment of the bigger trend is important because it dictates my trading bias. When the bigger trend is up, I am looking for short-term bullish setups and I view short-term oversold conditions as opportunities. Short-term bullish patterns include falling flags, falling wedges, pennants, bullish enguflings, hammers with follow through and piercing patterns.
The S&P 500 SPDR (SPY) surged around 15% from mid February to mid April and then corrected over the last few weeks. This correction is extremely mild because the ETF is currently around 2% from the mid April high, which was an all time high. Trading has been quite choppy since early April, but this just implies a stalemate between buying pressure and selling pressure. SPY closed at a four week low on Friday and then bounced on Monday. I extended the Raff Regression Channel to this low and adjusted first resistance (208.2). A breakout here would reverse the four week slide and call for a continuation of the bigger uptrend.

QQQ Reflects Strength in Tech
The Nasdaq 100 ETF (QQQ) is holding up a little better than SPY because it held above the early May closing low on Friday. Notice that QQQ broke out with a surge above 107 last Tuesday, pulled back for three days and then bounced on Monday. StochRSI also surged back above .80 to signal a momentum thrust. This is short-term stuff and I will mark support at 105. A close below this level would erase Monday's bounce and put QQQ back in a short-term downtrend.

IWM also hit a new low for the move on Friday and I extended the Raff Regression Channel to account for this closing low. The upper line and last week's high mark resistance in the 112-112.50 area. IWM has been underperforming since late April and this shows some risk-aversion in the market right now. Look for the price relative to break above last week's high to signal a stronger risk appetite.

Watching Bonds for Clues on Risk Appetite
A successful short-term reversal in stocks may depend on the bond market. Note that SPY is negatively correlated with the 7-10 YR T-Bond ETF (IEF), which means they tend to move in opposite directions. Bonds represent the ultimate safe-haven asset and strength here indicates some risk aversion in the market. On the price chart, IEF broke above the triangle trend line in early May and then stalled in the 110.5 area. The short-term trend (three weeks) is clearly up and this coincided with a corrective period for stocks (risk off). I am marking short-term support at 110 and will watch this level for signs of a short-term reversal in IEF. Right now the short-term trend is clearly up and this is negative for stocks. A support break at 110 would be positive for stocks. The second chart shows the 10-YR Treasury Yield ($TNX) and 18 (1.8%) is the key level to watch.


Adding an Exit Strategy to the PPO Signals
According to the PPO Strategy, there is a bullish setup in RSP and some other ETFs right now. There are three things required for a PPO strategy signal. First, the trend filter is bullish. PPO (10,60,1) and PPO (20,120,1) are both positive for RSP right now. Second, the short-term PPO (5,30,1) moves into the zero area for a bullish setup. Third, the PPO crosses above the zero line or above its signal line for an actual signal. The PPO dipped into negative territory on Friday for a setup and crossed above its signal line on Monday for a bullish signal.

Stops and trade management are much more difficult than entries. This is a sort of mean-reversion system because I am looking for pullbacks within a bigger uptrend. Most successful mean-reversion systems look to exit after a bounce and some systems work better without stops. In other words, just use profit targets. I will be expanding on this in the next few weeks. For now, chartists can consider placing a stop-loss just under the May low (78) and then using CCI for a target type system. A decline in RSP will trigger a stop. A rise in RSP will result in a rise in CCI. Look for CCI to move above 100 and then hold until CCI moves below 50.
Watching Regional Banks, Semis and Homebuilders
The Regional Bank SPDR (KRE), Semiconductor SPDR (XSD) and Home Construction iShares (ITB) represent key areas of the market that can help define the broader market environment. Regional banks are sensitive to interest rates and should rise if Treasury yields rise. Semiconductors are cyclical tech stocks that reflect the global economy. Homebuilders represent the domestic economy (housing, durable goods). First up, ITB fell sharply at the end of April and then firmed the last two weeks. This consolidation is just as tight as the April consolidation (blue ovals). Chartists can watch 26 down and 27 up.

KRE dipped below its early May low last week and remains in a short-term downtrend. Nevertheless, the ETF is still in a potential reversal zone as an inside day formed on Monday. This shows short-term indecision and I am watching 40 for a breakout to reverse the short-term downtrend.

I featured XSD in Monday's Don't Ignore this Chart blog as it bounced near the 200-day moving average. This ETF is also in a potential reversal zone marked by support from broken resistance, the flat 200-day moving average and the 50% retracement. XSD formed an inside day on Friday and bounced on Monday, but fell short of a breakout. Look for follow through above 42.5 to reverse the short-term downtrend.

Finance Sector Fails to Pop
The chart below shows the Finance SPDR within an uptrend since the mid February reversal. The short-term trend is down and this is viewed as a correction. The Raff Regression Channel and last week's high mark resistance. Chartists looking for a bullish indicator signal can watch StochRSI for a pop above .80 to signal a short-term momentum thrust.

SKYY and IGV Show Relative Strength
While the broader market fell back Wednesday-Thursday-Friday, I noticed that the Cloud Computing ETF (SKYY) and Software iShares (IGV) held up quite well. This little show of relative strength could foreshadow upside leadership should SPY reverse its short-term downtrend. SKYY surged in February, worked its way higher from early March to mid April and then corrected with a decline to support in the 28.5 area. The red Raff Regression Channel marks this pullback and SKYY broke out with a surge above 29.5 last Monday. This breakout largely held even as the market pulled back last week. IGV bounced off support in early May and broke out last week.


Webinar Preview
I will cover the charts above and the following in today's webinar (Tuesday, May 17th, 1PM ET).
- FAAAM Driving QQQ (FB, AAPL, AMZN, GOOGL, MSFT)
- XLE and XES Not Following Oil
- Oil, Gold and the Dollar
******************************************************
Measuring Risk On-Risk Off - Using charts to quantify stock, economic and credit risk.
PPO Trading Strategy - How to use 3 PPOs to develop a trend-reversion trading strategy.
Long-term Trend Indicators - Using the PPO, EMA Slope and CCI to determine the trend.
ETF Master ChartPack - 300+ ETFs organized in a Master ChartList and in individual groups.
Follow me on Twitter @arthurhill - Keep up with my 140 character commentaries.
****************************************
Thanks for tuning in and have a good day!
--Arthur Hill CMT
Plan your Trade and Trade your Plan
*****************************************
