Keep Your Eye on the Rising Channels // Small-caps and Mid-caps are Leading // Healthcare and Finance Not doing That Bad // 10-yr Yield Springs a Bear Trap // Rising Yields Could Lift Banks // What does a High Volume Spinning Top Suggest? // Five Annotated Stock Charts worth Watching //// ......
Keep Your Eye on the Rising Channels
The major stock indexes are relatively flat over the last two months, but the charts show an upward drift in all but the Nasdaq 100. The chart below shows three broad indexes and the Nasdaq 100, which is really not that broad of an index (mostly tech and some biotech). The green dotted lines on the first three show rising channels that took shape since early April. Note that these rising channels followed a sharp advance from mid February to late March. The rising channels show that the advance slowed over the last few months, but the indexes still sport higher highs and higher lows from April to June. Thus, the uptrends remain in place.
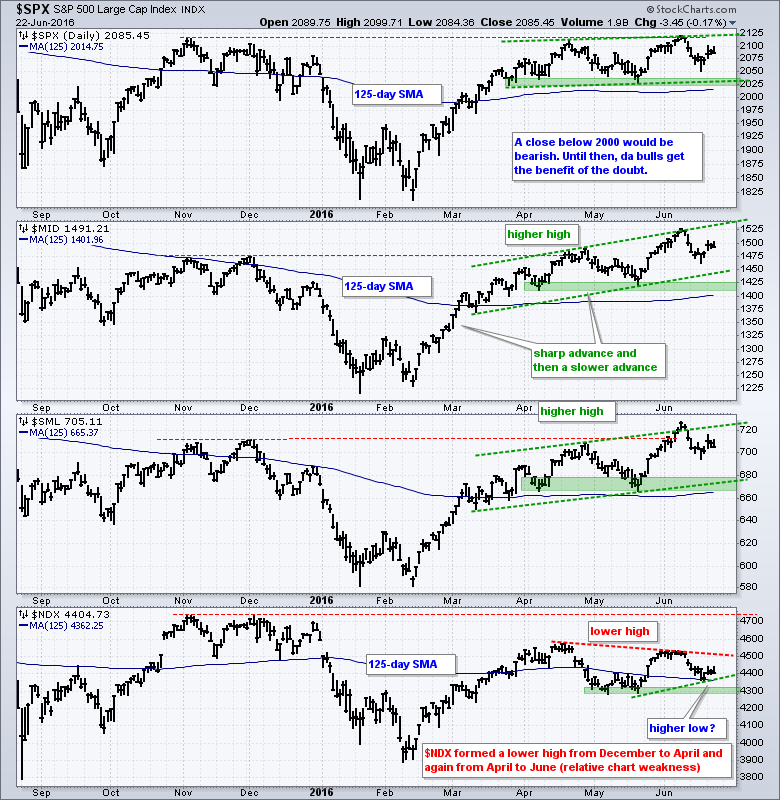
Elsewhere, the red horizontal lines mark the November-December highs. Notice that the S&P 500, S&P MidCap 400 and S&P Small-Cap 600 exceeded these highs. The Nasdaq 100 is the only one to form a lower high and show relative chart weakness. The green shaded areas mark key support based on the April-May lows. In particular, I would not turn bearish on the S&P 500 unless it breaks 2000. As long as I remain bullish on stocks, I will expect the uptrends to continue and this points to new highs in the coming weeks.
Small-caps and Mid-caps are Leading
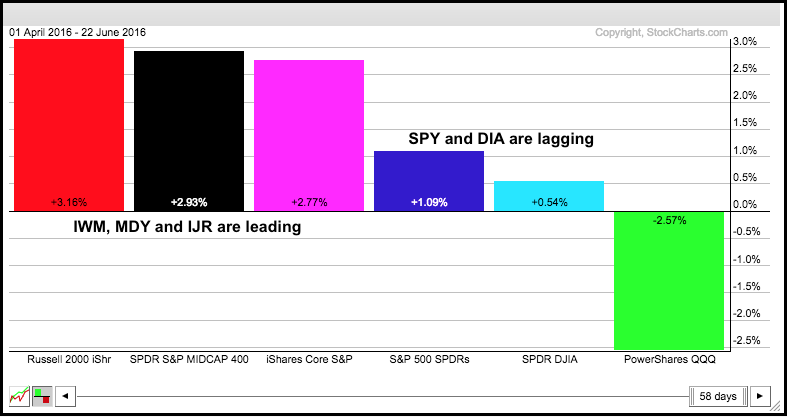
The PerfChart below shows the performance for six major index ETFs since April 1st, which is when the choppy advance began. Notice that the Russell 2000 iShares, S&P MidCap SPDR and S&P SmallCap iShares are leading the pack. The S&P 500 SPDR and Dow Diamonds are up, but up much less than these three. The Nasdaq 100 ETF is the only one with a loss since early April. Even though large-cap techs are lagging, I think relative strength in small-caps and mid-caps is a bullish sign for the market because it points to a relatively strong risk appetite.
Healthcare and Finance Not doing That Bad
The next PerfChart shows performance for the EW S&P 500 ETF (RSP) and the nine equal-weight sector ETFs since April 1st. Energy is the clear leader with materials a distant second. EW Healthcare is in a surprising third place and barely outperforming RSP (red bar). EW Finance (green) is barely underperforming RSP, which is the broad market benchmark. Thus, finance and healthcare have performed pretty much in-line with RSP since April.
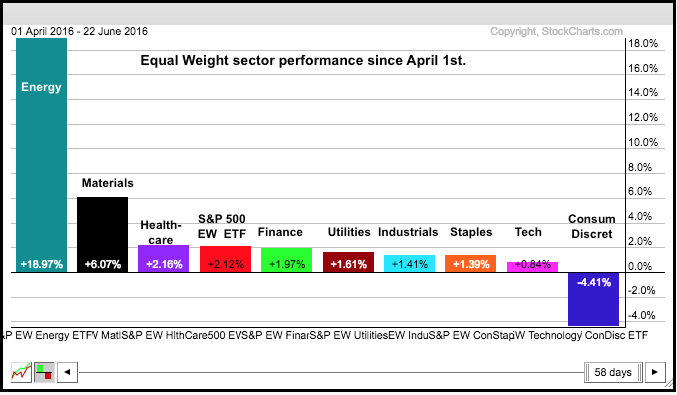
The clear laggards are EW Tech, which is up less than 1%, and EW Consumer Discretionary, which is down over 4%. Even though relative weakness in tech and absolute weakness in consumer discretionary is negative, keep in mind that the other seven sectors are up by more than 1% since April. Seven is still greater than two and these seven sectors are enough to keep the broader market in an uptrend.
10-yr Yield Springs a Bear Trap
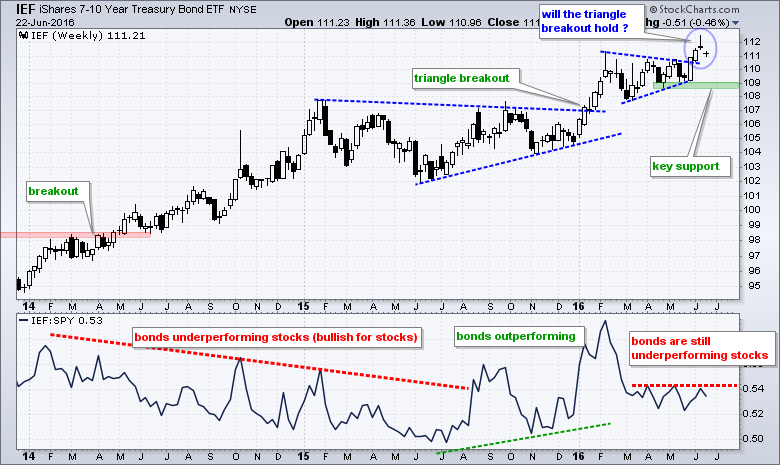
I realize that the 10-YR Treasury Yield ($TNX) is not actually traded, but it is a reflection (quite literally) of the 10-yr Treasury Note and this instrument is traded. It is basically, the mirror image of the 10-yr -Note and chartists can analyze $TNX just like any other tradable instrument.
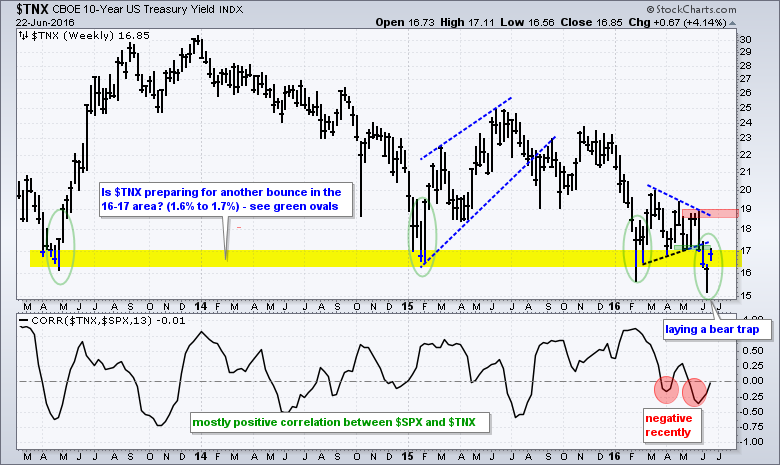
Treasury yields made headlines earlier this month as the 10-YR Treasury Yield broke triangle support and dipped to multi-year lows. These lows, however, did not hold as $TNX bounced back above 17 (1.7%) this week. Treasury yields are sharply higher again on Thursday morning and Treasury bonds are sharply lower. As the risk of believing the financial press, this is because Brexit fears are subsiding fast. On the price chart, it is very possible that a bear trap was set last week and the 10-YR Treasury Yield may actually hold the 16-17 zone again. A bear trap is a failed support break and a failed bearish signal is positive. I am setting resistance at 19 and a breakout here would forecast a move to the mid 20's (2.4-2.5% area).
Rising Yields Could Lift Banks
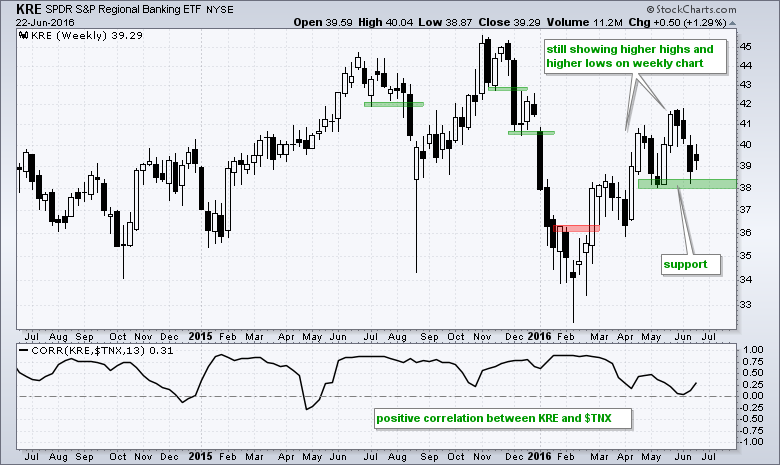
A rise in the 10-YR Treasury Yield would be positive for banks and this would be positive for the market. The chart below shows the Regional Bank SPDR (KRE) and the Correlation Coefficient ($TXN,KRE) in the indicator window. Notice that the Correlation Coefficient is positive and this means they tend to move in the same direction. A rise in the 10-YR Treasury Yield, therefore, would be very positive for banks. Returning to the price chart, KRE still sports higher highs and higher lows since the February breakout. Even though I showed a break below the lower trend line of a rising wedge on the daily chart (Tuesday), this weekly uptrend remains as long as support at 38 holds. Morever, the rebound in Treasury yields supports a successful support test.
What does a High Volume Spinning Top Suggest?
I am not much of a bottom picker and I don't use ETF volume in my analysis, but I did notice that the Biotech iShares (IBB) formed a big spinning top with high volume on Wednesday. The spinning top shows indecision and volume spikes sometimes mark reversal points. On the price chart, IBB is in a long-term downtrend, but the ETF is near a potential support zone and RSI is near oversold levels. This is a pretty good spot for a short-term reversal and at least an oversold bounce. The highs of the last six days mark first resistance at 263. Look for a breakout here to reverse the short-term downtrend.
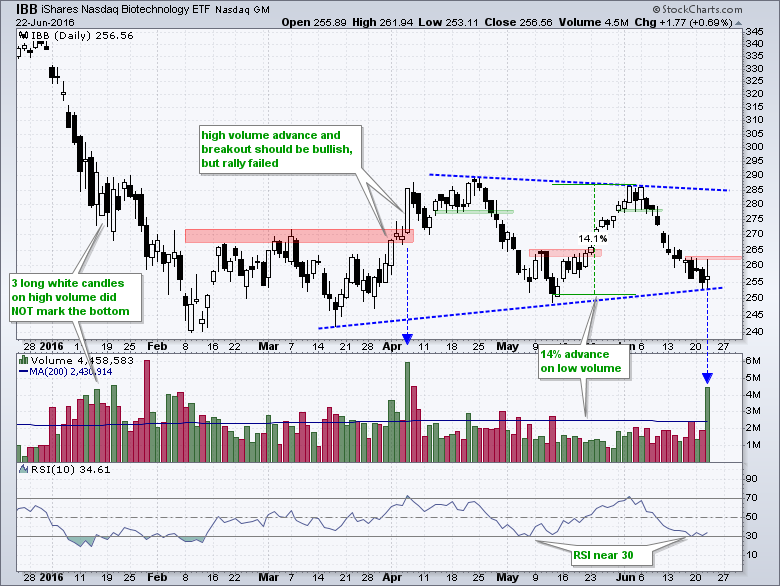
I am not a big fan of exchange volume because there are dark pools and lots of big blocks changing hands outside of the exchanges. I am not a fan of ETF volume because it does not always work in the classical sense. In addition, the components within the ETF drive price more than ETF volume. On the chart, first notice that three long white candlesticks on high volume did not mark a bottom in January. Second, note that IBB peaked soon after a high volume breakout in early April. Upside volume continued to outpace downside volume in early April and the breakout failed all the same. Third, the ETF advanced 14% on low volume in May-June. Thus, interpreting ETF volume can be tricky and I prefer to rely on price action.
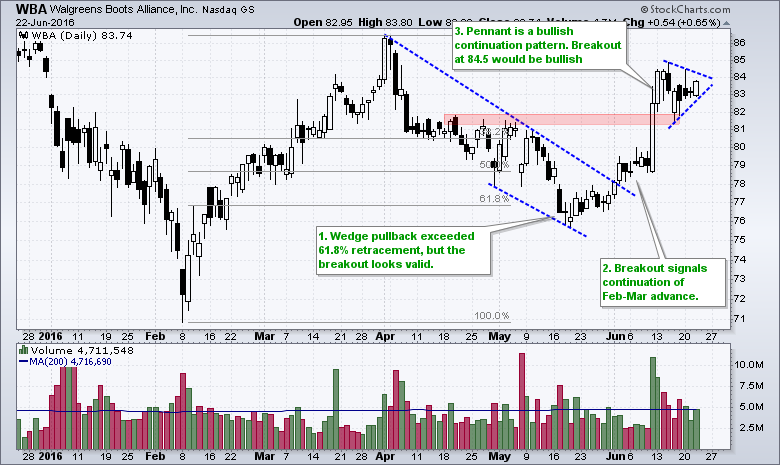
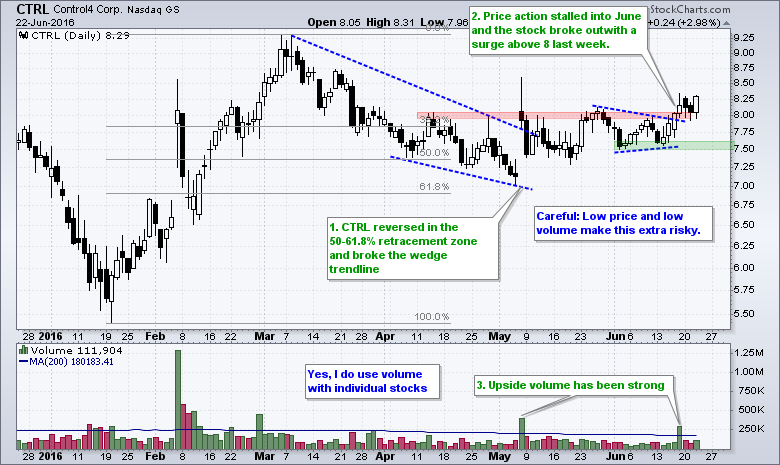
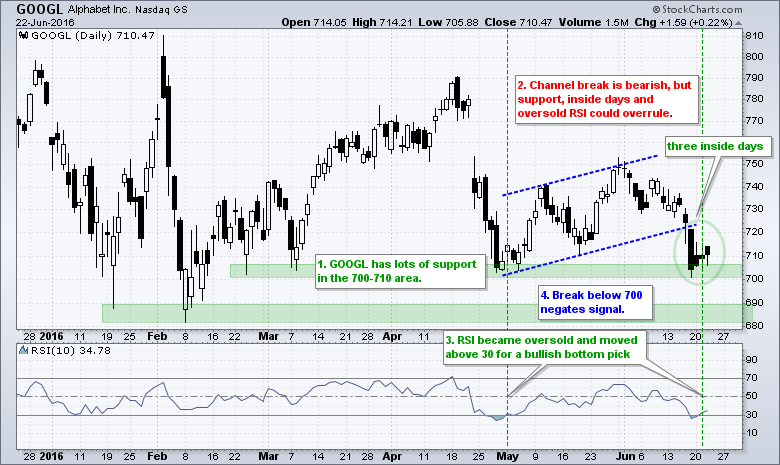
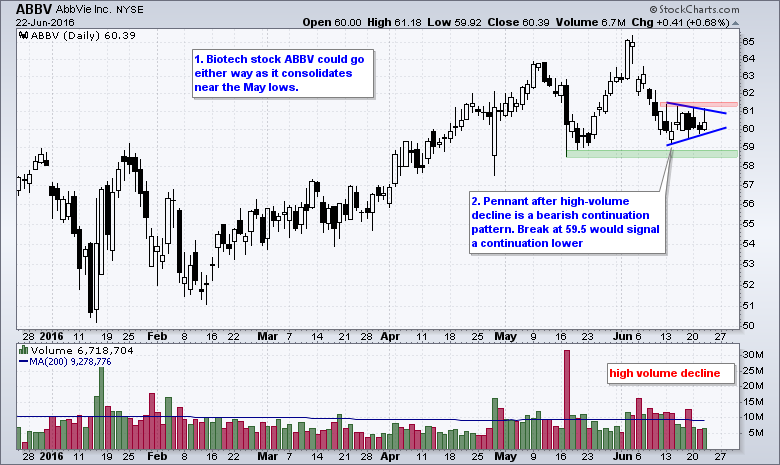
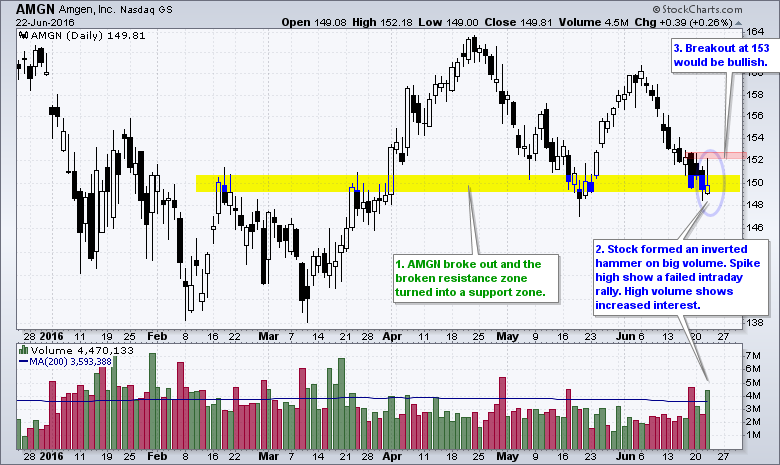
Five Annotated Stock Charts to Watch
******************************************************
Measuring Risk On-Risk Off - Using charts to quantify stock, economic and credit risk.
PPO Trading Strategy - How to use 3 PPOs to develop a trend-reversion trading strategy.
Long-term Trend Indicators - Using the PPO, EMA Slope and CCI to determine the trend.
ETF Master ChartPack - 300+ ETFs organized in a Master ChartList and in individual groups.
Follow me on Twitter @arthurhill - Keep up with my 140 character commentaries.
****************************************
Thanks for tuning in and have a good day!
--Arthur Hill CMT
Plan your Trade and Trade your Plan
*****************************************
