Stocks Bounce after Weak Open // SPY Remains In Trend // IWM Continues to Lead // XLE and XLI are in the Spotlight //// ....
Stocks Bounce after Weak Open
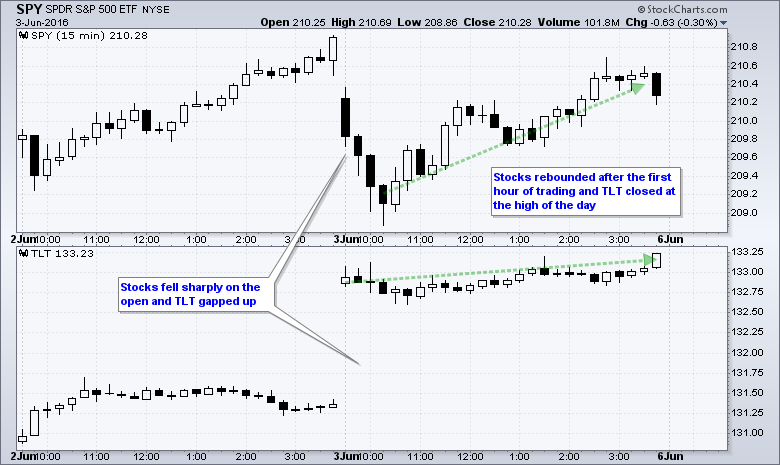
By now we are all aware of the big miss in the employment report. This miss triggered strong buying pressure in Treasury bonds and Treasury yields fell sharply. With stocks and bonds negatively correlated for the most part, one would have expected strong selling pressure in stocks. Stocks started the day with a sharp decline, but rallied by the close and finished with small losses. I was impressed with the ability of the stock market to rebound on Friday and remain bullish on stocks.
Risk Indicators still Bullish Overall
It is interesting to analyze correlations and market relationships, but these can sometimes be more of a distraction than a benefit. The stock market is the stock market and the bond market is the bond market. Whoa, that was profound. Even though correlations do exist and relationships seem to make sense, correlations are subject to change without notice. This is why I think it is important to focus on the price chart of the underlying asset. In other words, the price chart for SPY is more important than the correlation between SPY and the 20+ YR T-Bond ETF (TLT).
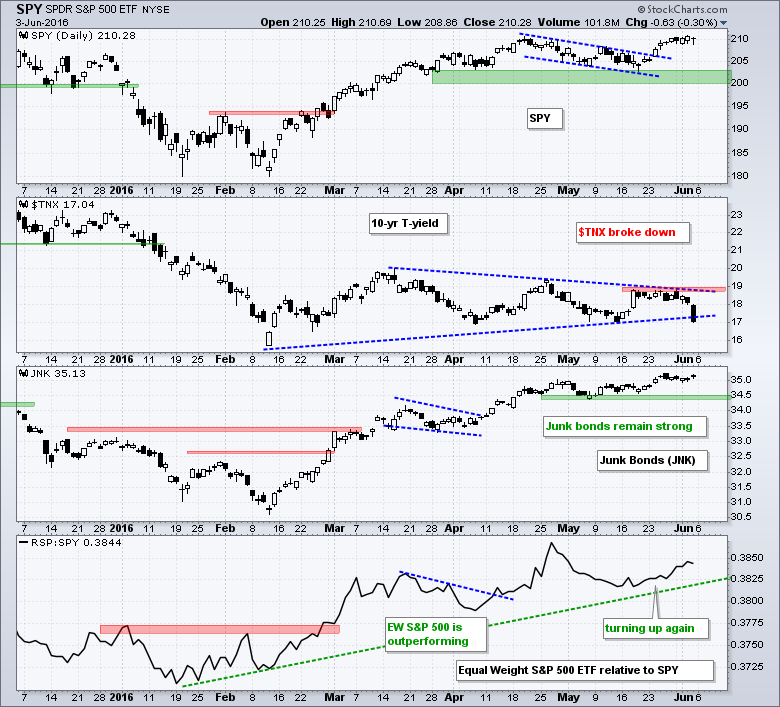
Having said that, the chart above shows SPY and three risk indicators that I watch. The 10-YR Treasury Yield ($TNX) broke down on Friday, the High Yield Bond SPDR (JNK) remains in an uptrend and the RSP:SPY ratio turned up over the last three weeks. Thus, the 10-yr yield points to risk off and the other two point to risk on.
SPY Remains In Trend
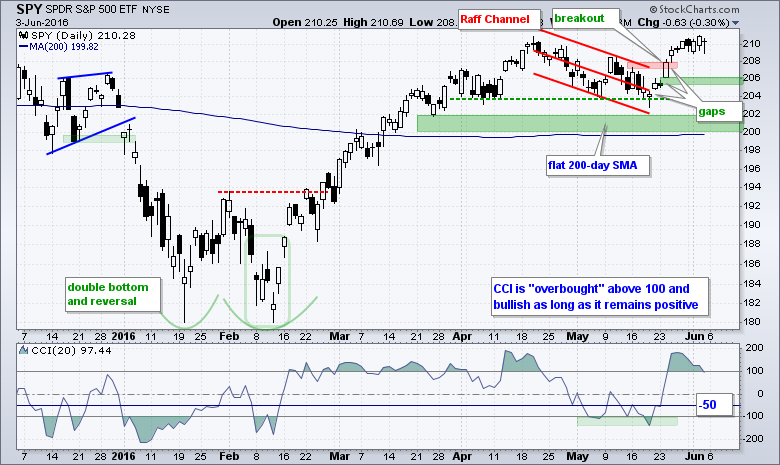
There is no change in the analysis for the major index ETFs. All three reversed course in mid May and broke out on 24-25 May. This means the major index ETFs are currently "in trend" and this trend is up. I am now looking for signs of weakness that would reverse this uptrend. SPY gapped up three times and all three gaps are holding. The middle gap marks the first level to watch and a close below 205 would call for a re-evaluation.
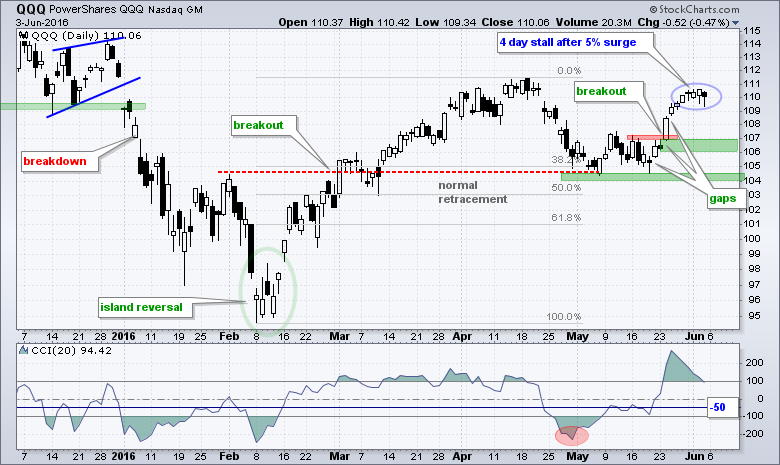
QQQ stalled around the 110 area the last four days, but this reflects a short-term stalemate between buying pressure and selling pressure. Note that QQQ surged around 5% and the ETF is entitled to a small rest. The 24-May gap and breakout mark the first level to watch for a failed breakout (106-107).
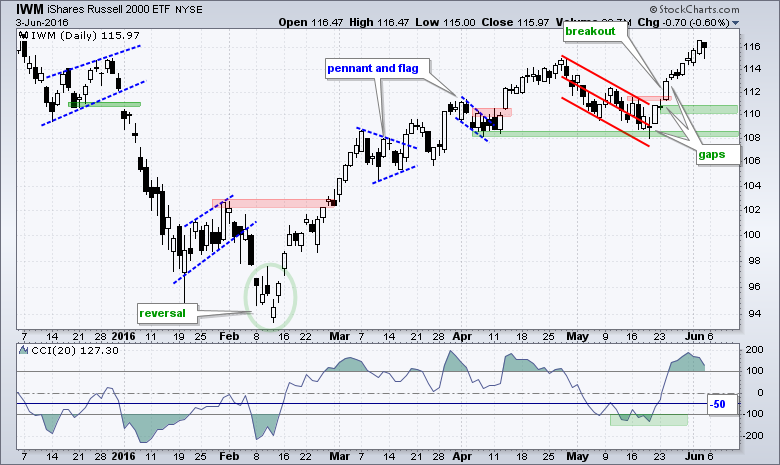
IWM Continues to Lead
IWM was up 1.2% last week and led the major index ETFs (SPY +.02%, QQQ -.06%, MDY +.51%). Small-caps and mid-caps are leading right now. My first watch level is 110 for IWM. I am also using CCI(20) for a move below -50 on all three charts. Momentum is clearly bullish as long as CCI remains positive. I added a small buffer and will re-evaluate should CCI move below -50.
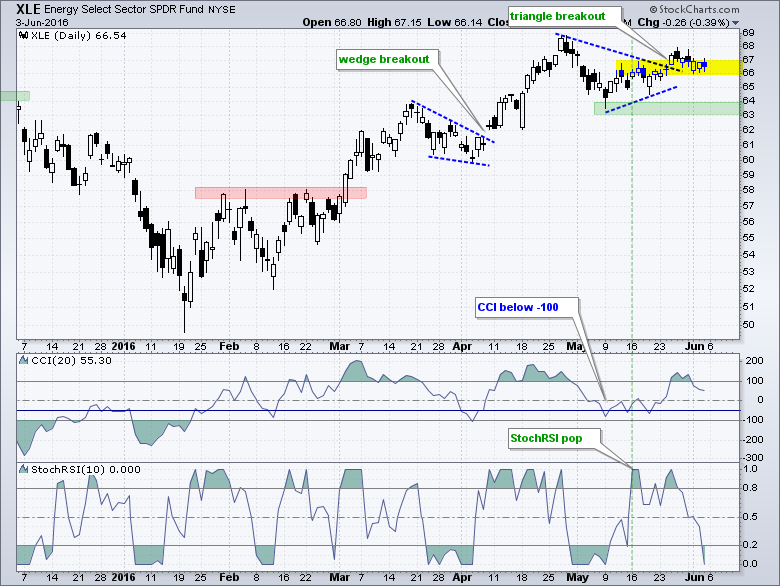
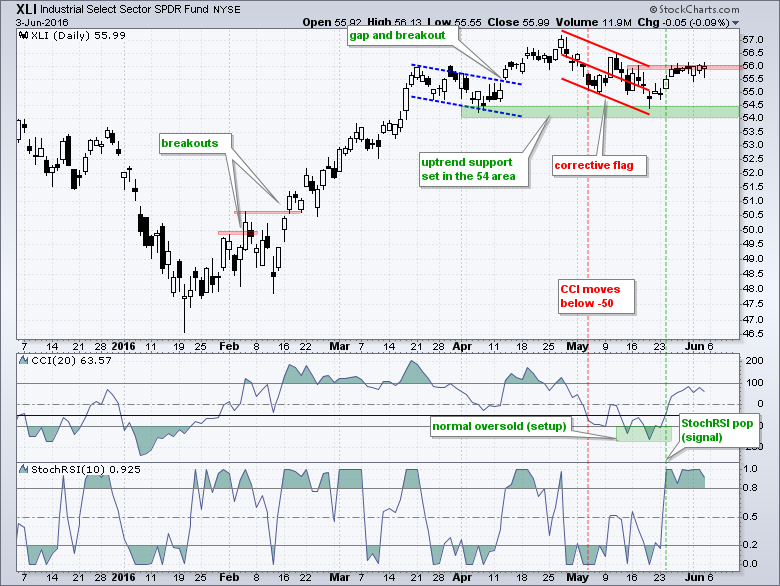
XLE and XLI are in the Spotlight
Overall, the sector SPDRs remain strong and supportive of an uptrend in SPY. XLK, XLV and XLF broke out on 24-25 May. XLU hit a new high on Friday and XLP is within 1% of a new high. This week I am watching the Energy SPDR (XLE) and the Industrials SPDR (XLI) because they are close to their original breakouts. These two are lagging a bit because they did not follow through on the 24-May signals. A signal triggers when the bigger trend is up, CCI(20) moves below -100 to become short-term oversold and StochRSI(10) then pops above .80 to signal a momentum breakout. XLE triggered a signal back on 16-May and broke the triangle trend line a week later. This ETF is still hovering in this breakout area and StochRSI dipped back below .20 last week. A pop above .80 would trigger another momentum signal.
XLI triggered a short-term signal on 24-May and then stalled in the 56 area the last six trading days. The red Raff Regression Channel marks resistance here and the ETF is on the verge of a breakout on the price chart.
******************************************************
Measuring Risk On-Risk Off - Using charts to quantify stock, economic and credit risk.
PPO Trading Strategy - How to use 3 PPOs to develop a trend-reversion trading strategy.
Long-term Trend Indicators - Using the PPO, EMA Slope and CCI to determine the trend.
ETF Master ChartPack - 300+ ETFs organized in a Master ChartList and in individual groups.
Follow me on Twitter @arthurhill - Keep up with my 140 character commentaries.
****************************************
Thanks for tuning in and have a good day!
--Arthur Hill CMT
Plan your Trade and Trade your Plan
*****************************************
