 Click here for the webinar video recording
The Song Remains the Same for SPY // Upward Price Action > Waning Momentum // IWM Continues to Lead // Bollinger Band Squeezes for KRE and XLF // Beware of the Head Fake // Adding a Trend Condition // Scanning for Bollinger Band Squeezes // Webinar Preview //// .....
The Song Remains the Same for SPY
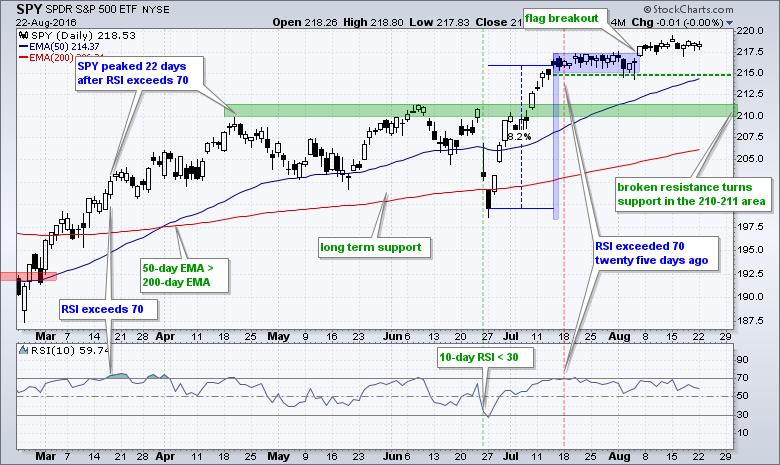
Not much is happening with the major index ETFs, but the upward bias remains clear and I have yet to see even a short-term trend reversal on the price charts. Even though you may already know the story, I will repeat the background to make sure we are on the same page. SPY surged around 8%, stalled with a flag and broke flag resistance on August 5th. The ETF then went on another stall just above 217.5 the last two weeks. There is still a slight upward drift over the last five weeks and this means the short-term trend is up. This also means that buying pressure, however weak it may seem, is still stronger than selling pressure. It is what it is. I will mark first support at 215 and second support in the 210-211 area.
Rising Price Action > Waning Momentum
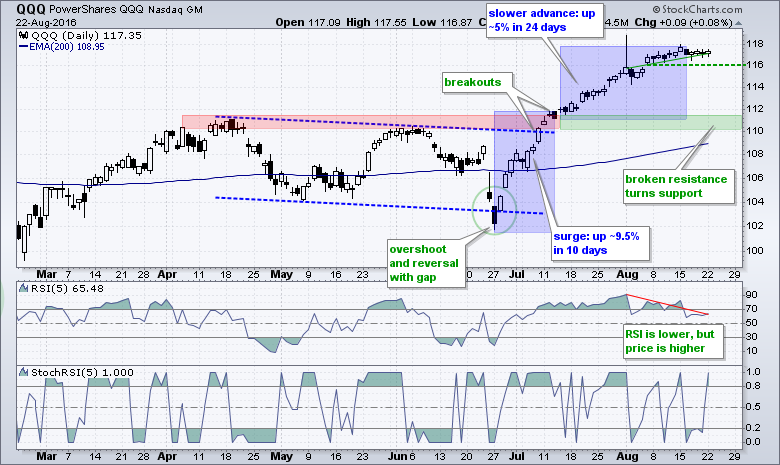
QQQ surged around 9.5% in five days and then advanced another 5% in 24 days. Some momentum indicators moved lower due to the slowness of this advance, but the advance has yet to actually reverse. Notice that RSI peaked above 90 on August 1st and is currently near 65. Momentum has slowed, but the uptrend remains intact because prices moved higher during this timeframe. Price action is more important than momentum because the trend is not actually broken until price says it is. I am marking first support at 116 and second support in the 110-111 area.
IWM Continues to Lead
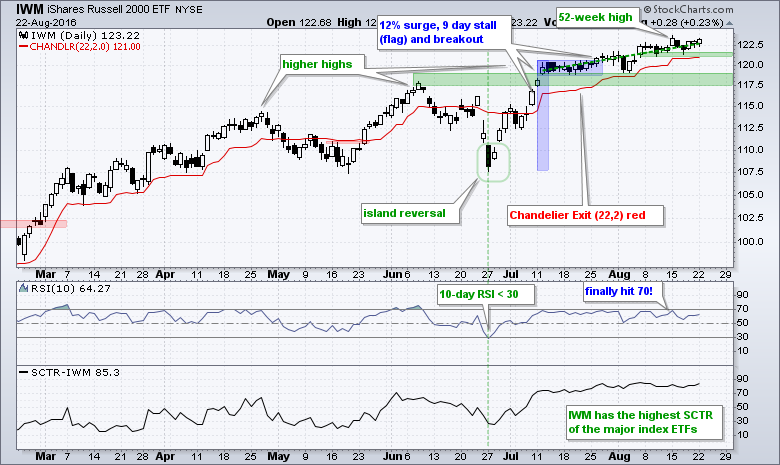
IWM has the highest StockCharts Technical Rank (SCTR) of the major index ETFs and the highest three month Rate-of-Change (+11.83%). Also note that IWM hit a 52-week high this month. In short, small-caps show relative strength. On the price chart, IWM surged 12%, formed a flat flag and broke flag resistance in late July, which was a week before SPY broke flag resistance. The dotted green line shows a clear upward trajectory since July 13th and the short-term trend is up. First support is set at 121 and second support in the 117.5-118.5 area.
Bollinger Band Squeezes for KRE and XLF
There are a lot of Bollinger Band Squeezes out there right now so I thought it a good time to review this setup and show a scan. First, let's review some guidelines for the Bollinger Band Squeeze. Developed by John Bollinger and detailed in his book, Bollinger on Bollinger Bands, Bollinger Bands measure of volatility. The middle band is a 20-day SMA, the upper band is set two standard deviations above the SMA and the lower band is set two standard deviations below the SMA. The bands widen when volatility expands and narrow when volatility contracts. Bollinger theorized that a volatility expansion (significant price move) follows a volatility contraction (flat price action).
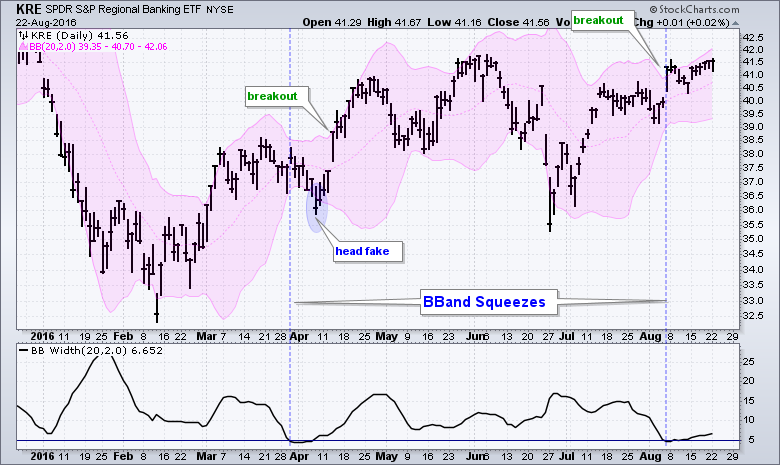
Chartists can measure the width of the Bollinger Bands by using the Bandwidth indicator ((upper band - lower band)/middle band). According to Bollinger, a squeeze occurs when BandWidth dips to a six month low. Traders should be on guard for a significant directional move (volatility expansion) when this occurs. Chartists can also look at the chart to see when BandWidth reaches a relatively low level.
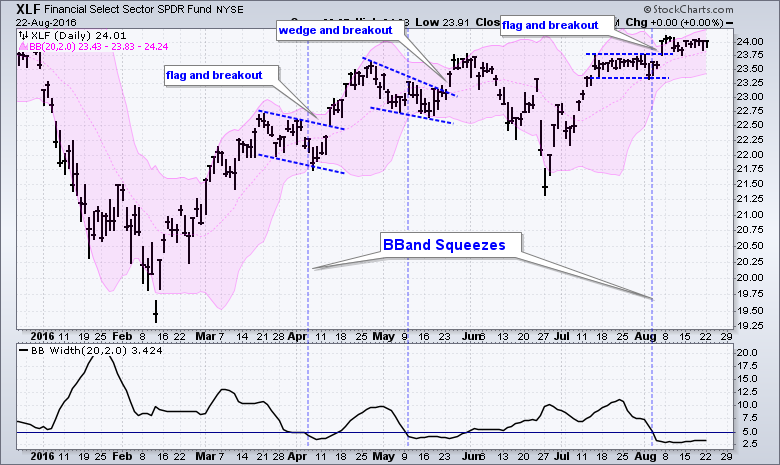
Beware of the Head Fake
Once BandWidth declines to a significant level, chartists must then turn to other indicators for a directional bias (volume, momentum, trend, price patterns). The XLF chart above shows pattern breakouts occurring after the Bollinger Band squeeze. Chartists can also look for a move above the upper band for a bullish signal or a move below the lower band for a bearish signal. A trailing stop can then be placed using Parabolic SAR or the Chandelier Exit.
John Bollinger notes that traders should be wary of the "head fake". This occurs when prices break the upper (lower) band, but fail to hold this break and promptly move the other direction, subsequently breaking the other band. It is a classic whipsaw or bull/bear trap. These are all part of the trading game and we need to be aware of the possibilities.
Adding a Trend Condition
As readers are probably aware, I am a big fan of setting a trend condition and trading in the direction of that trend. The bigger trend is the most dominant force on the price chart and we should leverage this force, not act against it. Chartists can define the bigger trend by using moving averages, Aroon and other indicators. I am going to opt for the most basic moving average pair by using the 50-day EMA and 200-day EMA. The trend is up when the 50-day is above the 200-day and down when the 50-day is below the 200-day. I would then expect a bullish resolution to a Bollinger Band squeeze when the bigger trend is up and a bearish resolution when the bigger trend is down.
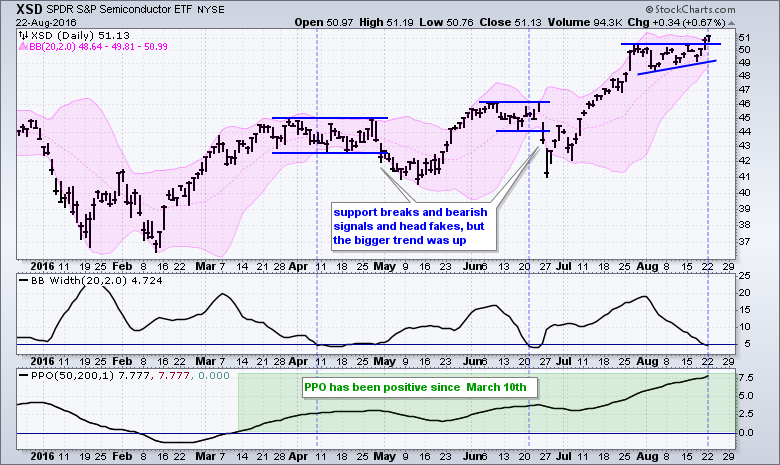
The chart above shows the Semiconductor SPDR (XSD) with Bollinger Bands, BandWidth and the PPO (50,200,1). This PPO is positive when the 50-day is above the 200-day and negative when the 50-day is below the 200-day. There were Bollinger Band squeezes in April and June, and subsequent support breaks. Adding a simple trend condition to quantify signals would have negated these signals. In other words, I would not have taken them because the overall trend was up and I ignore bearish signals when the bigger trend is up. This will not work all the time, but trend condition is part of my strategy and I prefer to stick with the strategy.
Scanning for Bollinger Band Squeezes
Chartists can scan for potential Bollinger Band squeezes using the BandWidth indicator and the advanced scan workbench. There is really only one line of code needed to detect a low point in BandWidth.
[group is SP500] and
[Min(10,BB Width(20,2)) < 11 days ago Min(90,BB Width(20,2))]
Let's break this line down. The first phrase (Min(10,BB Width(20,2)) means I am looking for the 10-day minimum value of BandWidth based on 20-period Bollinger Bands with 2 standard deviations. Next we have the "is less than" symbol (<). The next condition starts with "11 days ago" because I am looking for the 90 day minimum value of Bandwidth 11 days ago. This means the minimum value period does NOT overlap with the first 10 day period in the first phrase. We have a Bollinger Band squeeze if the current 10-day minimum value of BandWidth is below the 90-day minimum value of BandWidth 11 days ago. 90 days is around 4.3 months. Chartists looking for six months can use 126 days.
I ran this scan on a chartlist of ETFs and 47 have some sort of Bollinger Band squeeze in play right now. This is an exceptionally large list and suggests that we could get some volatility expansions in the coming weeks. September is right around the corner and we all know what Mark Twain allegedly said about October.
October: This is one of the peculiarly dangerous months to speculate in stocks. The others are July, January, September, April, November, May, March, June, December, August, and February.
In any case, here are the ETFs that made the Bollinger Band scan:
AGG,AMLP,BND,COPX,CORN,COW,CUT,DBA,DBB,DBP,
DIA,DJP,GDX,GLD,HACK,HYD,IBB,IEF,IJR,RSP,SLX,SPY,
TIP,XBI,XHB,XLB,XLF,XLI,XLP,XLV,XLY,XME,XPH,XRT
******************************************************
Measuring Risk On-Risk Off - Using charts to quantify stock, economic and credit risk.
PPO Trading Strategy - How to use 3 PPOs to develop a trend-reversion trading strategy.
Long-term Trend Indicators - Using the PPO, EMA Slope and CCI to determine the trend.
ETF Master ChartPack - 300+ ETFs organized in a Master ChartList and in individual groups.
Follow me on Twitter @arthurhill - Keep up with my 140 character commentaries.
****************************************
Thanks for tuning in and have a good day!
--Arthur Hill CMT
Plan your Trade and Trade your Plan
*****************************************
