 Webinar Recording ---- Webinar ChartList
SPY and MDY are Barely Positive this Month // RSI(5) and the Dreaded Double Dip // The Noose Continues to Tighten for Treasuries // How Yields Effect Gold, Utilities and Finance // US 10-yr Yields Sticks Out // XLF and KRE Maintain Breakouts // XLU and IYR Forge Bullish Setups // Gold Breaks, but Becomes Oversold //// .....
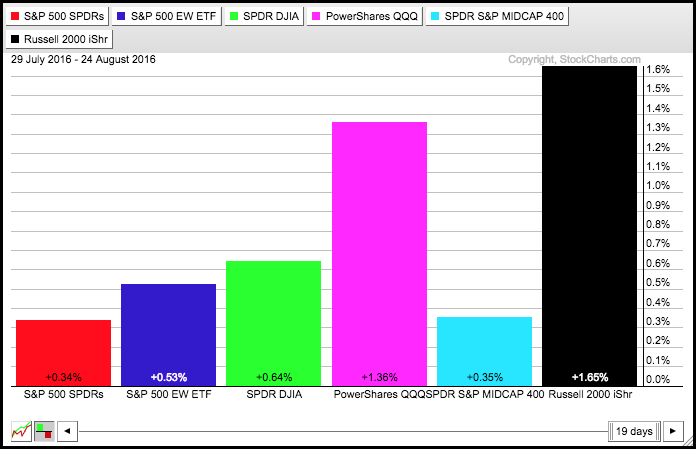
The major index ETFs fell modestly on Wednesday, but remain positive for the month of August (18 trading days). They are not up by much this month so it would not take much to push them in the red month-to-date. IWM and QQQ are leading this month with 1+ percent gains. SPY and MDY are lagging with gains less than .5%.
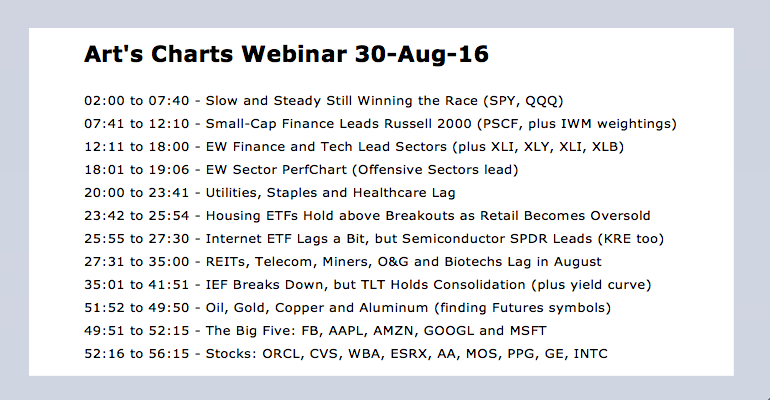
Slow and Steady Winning the Race // IWM Continues to Lead the Big 3 // Offensive Sectors Leading the Market // EW Tech and Finance ETFs Hit New Highs // Short Yields Surge as 30-yr Yield Stalls // Webinar Preview //// .....
Slow and Steady Winning the Race
The short-term uptrend in SPY may seem slow and buying pressure may seem weak, but there is clearly more uptrend than downtrend and more buying pressure than selling pressure. The first chart shows SPY with an 8.2% surge in three weeks and then a 1% grind higher the last six weeks. The 1% gain reflects the grind and the Raff Regression Channel defines the upward trajectory. The middle line is a linear regression and the six week trend is up because this linear regression has a positive slope. I will leave first support in the 215 area. The indicator window shows the PPO (5,30,5) peaking in mid July and falling the last six weeks. This reflects slowing upside momentum. It does not, however, equate to negative momentum.

QQQ flattened over the last few weeks, but is still holding the 5-Aug gap. The bigger trend is clearly up, but the ETF was up around 15% in mid August and ripe for a corrective period. This sideways consolidation could be that correction and an upside breakout at 118 would signal a continuation higher. While a break below 116 would be short-term negative, it would not have long-term implications and would likely lead to the next bullish setup (short-term oversold within a bigger uptrend). Look for RSI(5) to move below 30 for the first sign of a pullback.

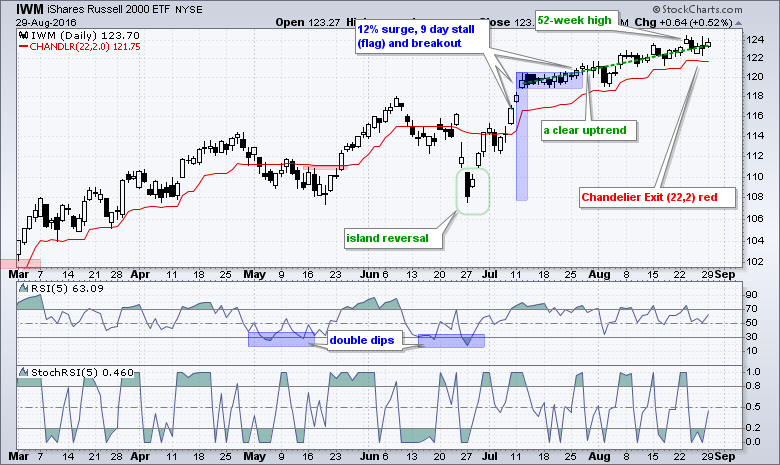
IWM Continues to Lead the Big 3
IWM remains the strongest of the big three (SPY, QQQ, IWM). Notice that the six week uptrend is steeper than that of SPY and the ETF hit a 52-week high last week. The Russell 2000 is strong because the SmallCap Financials ETF (PSCF) hit a new high on Monday and this sector accounts for 26.3% of the index. The Chandelier Exit (22,2) has been in place for weeks now and IWM has yet to close below this trailing stop. The short-term uptrend remains intact and I see nothing to do but watch and wait.
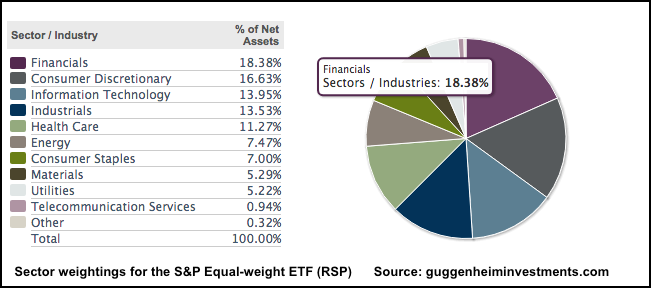
Offensive Sectors Leading the Market
Even though volume is too thin for trading, chartists can glean valuable information from the equal-weight sector ETFs. In particular, the EW Technology ETF (RYT) and EW Finance ETF (RYF) hit new highs on Monday and these two equal-weight sectors are leading. This tells us that there is BROAD strength in these two sectors. Finance accounts for 18.38% of the EW S&P 500 ETF (RSP) and technology accounts for 14%. I do not need to justify the importance of these two sectors. New highs in finance and technology support the bull market thesis. The PerfChart below shows EW sector performance over the last two months. Notice that the four "offensive" sectors are leading (finance, tech, industrials and finance). Utilities and staples, two defensive sectors, are actually down since June 30th.

EW Tech and Finance ETFs Hit New Highs
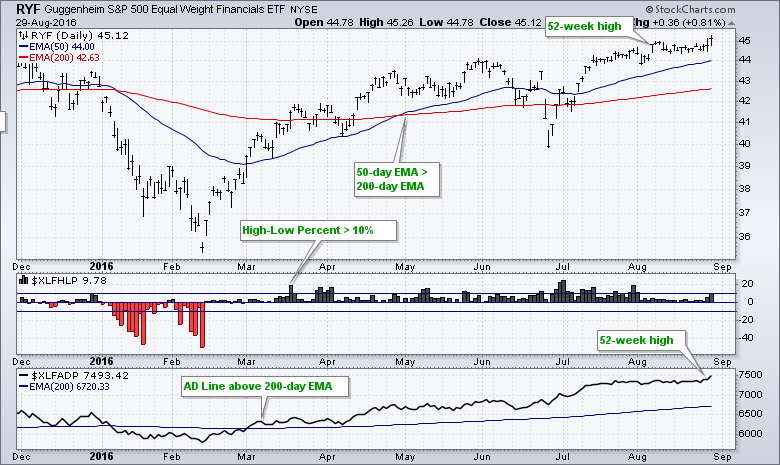
The chart below shows the EW Finance ETF (RYF) hitting a new high in early August and again last week. The Finance AD Line ($XLFADP) moved above its 200-day EMA in early March, Finance High-Low Percent ($XLFHLP) moved above +10% to turn bullish in mid March and the ETF experienced a golden cross in early May. These signals remain in play and support the overall uptrend.
The next chart shows the EW Technology ETF hitting 52-week highs in June, July and August. Also notice that the Tech AD Line ($XLKADP) crossed its 200-day EMA in mid February, Technology High-Low Percent ($XLKHLP) turned bullish in mid March and the 50-day EMA crossed the 200-day EMA in late March. Technology was one of the first sectors to turn bullish and it remains bullish.

Short Yields Surge as 30-yr Yield Stalls
Treasury yields have been moving higher the last two months, but the 30-year Treasury Yield ($UST30Y) is dragging its feet. The chart below uses "Price (same scale)" to show four different yields using one scale. The 30-yr yield is around 2.2%, the 10-yr yield is around 1.6%, the 5-yr yield is around 1.2% and the 2-yr yield is around .80%. Three of the four yields popped to two month highs last Friday, but the 30-yr yield did not exceed its mid August high and remained relatively flat. The sharp rise in the 2-year Treasury Yield ($UST2Y) is probably helping the finance sector. The 10-year Treasury Yield ($UST10Y) also remains in a short-term uptrend, but the 30-yr is the one to watch for the "mother of all" breakouts. Check out last Thursday's article for details on Treasury yields and correlations.

IEF Breaks, but TLT Remains in Triangle
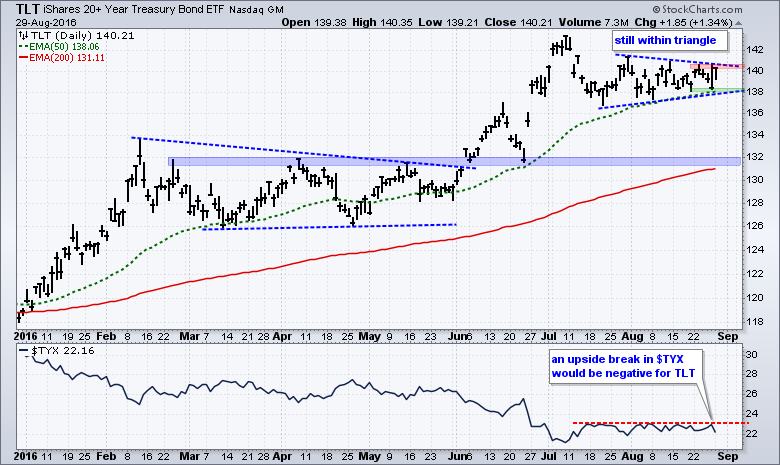
The 7-10 YR T-Bond ETF (IEF) broke triangle support on Friday and rebounded back into the triangle on Monday. Despite the rebound, I view this break as bearish as long as 112.5 holds. The 20+ YR T-Bond ETF (TLT) did not break triangle support and remains within the triangle consolidation. TLT is still short-term neutral pending the break. Watch 141 up and 138 down. The strongest signal from the bond market will come with both IEF and TLT have confirming breaks (up or down).

******************************************************
Measuring Risk On-Risk Off - Using charts to quantify stock, economic and credit risk.
PPO Trading Strategy - How to use 3 PPOs to develop a trend-reversion trading strategy.
Long-term Trend Indicators - Using the PPO, EMA Slope and CCI to determine the trend.
ETF Master ChartPack - 300+ ETFs organized in a Master ChartList and in individual groups.
Follow me on Twitter @arthurhill - Keep up with my 140 character commentaries.
****************************************
Thanks for tuning in and have a good day!
--Arthur Hill CMT
Plan your Trade and Trade your Plan
*****************************************
