SystemTrader // Adding Trend to Broad Market Assessment // Three Trend Following Indicators // Using Donchian Channels // Hard to Beat the Humble MA Crossover // Testing Crosses of the 40 Week EMA // Optimizing and Choosing a Focus Index // Setting up the Trend Troika // .....
Adding Trend to Broad Market Assessment
This is the fourth, and final, article in a series on determining the broad market environment - bullish or bearish. The first three articles showed how to use breadth indicators, including the 10-day EMA of AD Percent, High-Low Percent and the %Above 200-day EMA. This article will show some techniques to define the weekly trend for the broad market indexes. Chartists can then combine breadth and trend for a weight of the evidence approach to determining the broad market environment.
Importance of the Broad Market Environment
The broad market environment is perhaps the single most important factor to consider when investing or trading stocks. We can describe the broad market environment as bullish (bull market) or bearish (bear market). In general, we want to own stocks during a bull market because the vast majority of stocks rise during this phase. Conversely, we want to be out of stocks during a bear market because the vast majority of stocks decline. The market environment is basically the tide and we want to swim with the tide, not against it. This is why my first task is to define the broad market environment. The overall objective is to make outsized returns when the broad market environment is bullish and preserve capital when the broad market environment is bearish.
Three Trend Following Indicators
I will now look at three objective and quantifiable methods to define the long-term trend. I am using weekly charts and these signals are long-term enough for my purposes. Trend indicators work when trends take hold and don't work when trends fail. This means breakout systems, moving average crossovers and price channels all perform well when trends take hold. Conversely, these systems perform poorly in the absence of trends. The markets do not always trend, but all we need are a few good trends to make money over the long term.
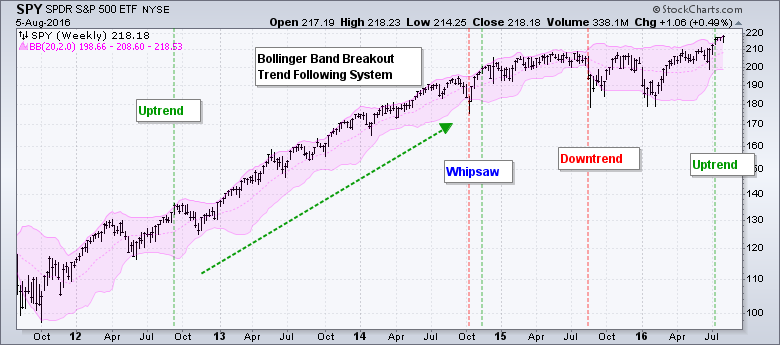
The first chart highlights the Bollinger Band breakout system with weekly bars for the S&P 500 SPDR. An uptrend starts with a break above the upper band (green line) and continues until a break below the lower band (red line), which signals the start of a downtrend. Over the last five years, this system caught one long trend that lasted around two years (green arrow).
Using Donchian Channels to Define the Trend
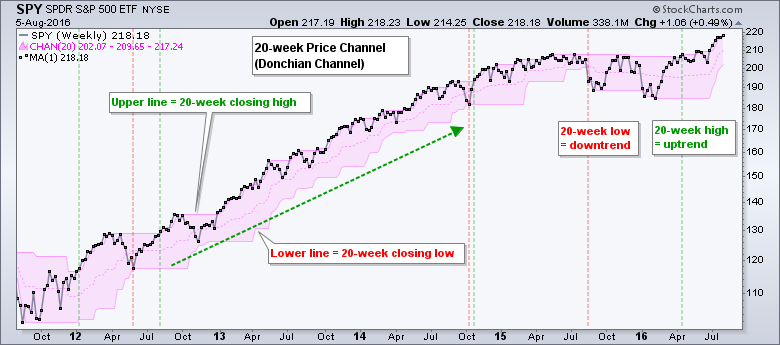
The second chart shows 20-week Price Channels to mark the 20-week high and 20-week low. This is a breakout system. Note that these Price Channels are the same as Donchian Channels, which were developed by Richard Donchian and used by the Turtle Traders for trend following. I am using closing prices only on this chart and this means the 20-week high/low is also based on closing prices. The red lines mark a new 20-week low to signal the start of a downtrend. The green lines mark a new 20-week high to signal the start of an uptrend.
Hard to Beat the Humble MA Crossover
The moving average crossover is the most basic trend following system and continues to work well. The 50-day and 200-day moving averages are the most widely used moving average pair. I am using weekly charts in this article and will use the 10-week and 40-week moving average. These two moving averages do not match up exactly with the 50-day and 200-day, but they have performed very well over the last 25 years.
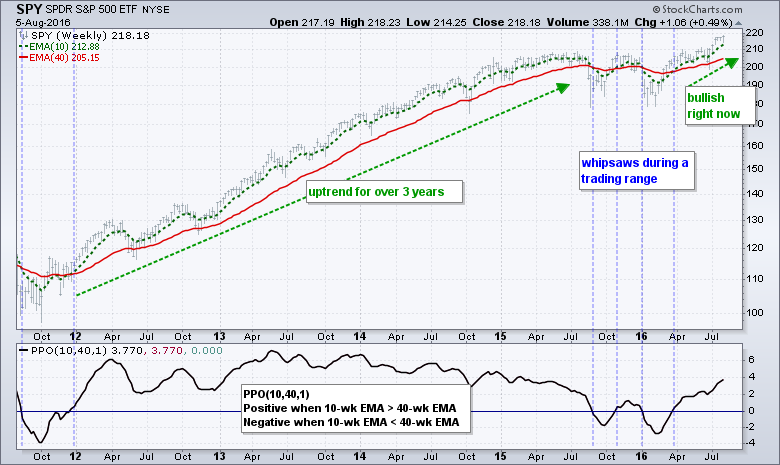
In order to speed things up a bit, I am also using exponential moving averages instead of simple moving averages. The chart below shows the S&P 500 with the 10-week EMA in green and the 40-week EMA in red. The indicator window shows the Percentage Price Oscillator (10,40,1) to highlight EMA crossovers. The PPO turns positive when the 10-week EMA crosses above the 40-week EMA and negative when the 10-week crosses below the 40-week.
Testing Crosses of the 40 Week EMA
I ran a backtest using the 40-week EMA with the S&P 500 Total Return Index ($SPXTR) and the S&P 500 Equal-Weight Total Return Index. Sorry, we do not have a symbol for the latter, but chartists can use the EW S&P 500 ETF (RSP) to trading and analysis. I am using the total return indexes for testing because dividends affect returns and we should include them in long-term backtests. By default, StockCharts adjusts ETF and stock data for dividends and this means we are looking at total return charts. Thus, RSP is adjusted for dividends and accurately reflects the S&P 500 Equal-Weight Total Return Index. There are three tests for each index.
- Buy/Sell on a close above/below the 40-week EMA
- Buy/Sell when 5-week EMA crosses above 40-week EMA
- Buy/Sell when 10-week EMA crosses above 40-week EMA.
First, notice that the Compound Annual Return increases as the system moves from closing prices to the 5-week EMA to the 10-week EMA. This suggests that smoothing really does help. Second, also notice that the winning percentage increased as smoothing increased.
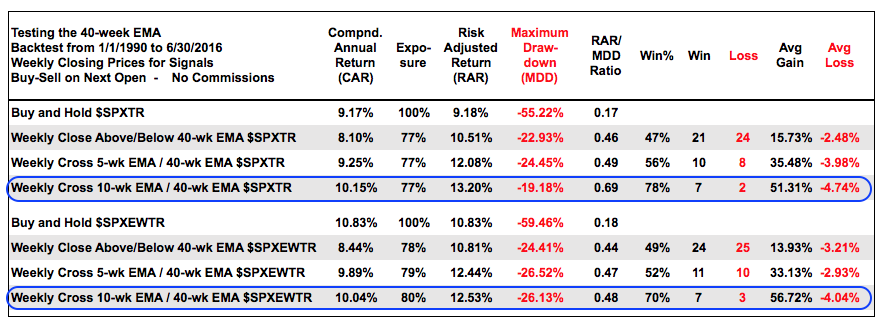 Third, notice that the 10-40 week EMA cross has the highest return of the three. Fourth, notice that exposure ranged from 77 to 80%. This means the system was out of the market 20-32% of the time (namely, the bear markets in 2001-2001 and 2007-2008). And finally, notice that there were just 9 signals in 25 years for the S&P 500 Total Return Index. One could have earned 10% per year over the last 25 years by simply taking these nine signals. Both indexes are currently on a bull signal. I did not include short positions because a long/short portfolio results in lower Compound Annual Returns and higher risk (exposure).
Optimizing and Choosing a Focus Index
Using weekly data, I tested a number of different moving average pairs and found that the 10-40 week EMA pairing works very well for the S&P 500, S&P 500 Equal-Weight Index, Nasdaq 100 and S&P MidCap 400. This EMA pair did not work as well for the Dow Industrials, Russell 2000 and S&P Small-Cap 600. Compound Annual Returns were 2-3% lower for these indexes. The Dow Industrials probably does not test well because it has just 30 stocks and is price weighted. Small-caps test different because they have different price characteristics than large-caps and mid-caps. For the S&P 500, the 10-40 EMA pair worked much better than the 5-52 EMA pair, the 10-52 EMA pair and the 5-30 EMA pair.
As far as I am concerned, the S&P 500 is really the only index we need to determine major trend for stocks. Yes, relative weakness in small-caps can sometimes foreshadow a market top, but the market does not top until the fat lady sings and the S&P 500 is the fat lady of the market. Note that the S&P 500 accounts for approximately 80% of the total investable equity universe in the US (source: spindices.com). This index accounts for the lion's share of the stock market and this is clearly the index we should focus on. If I had to pick two other indexes to follow, I would add the S&P 500 Equal-Weight Index and the Nasdaq 100.
Setting up the Trend Troika
In addition to the 10-40 week EMA pair, chartists can also use basic price chart analysis and the 40-week EMA to identify trend changes. A weekly close above the 40-week EMA is bullish and suggests that an uptrend is starting. A weekly close below the 40-week EMA is bearish and suggests that a downtrend is starting. As noted in the backtest table, closes above/below the 40-week EMA are still more prone to whipsaw and we should look for some confirmation (breadth).
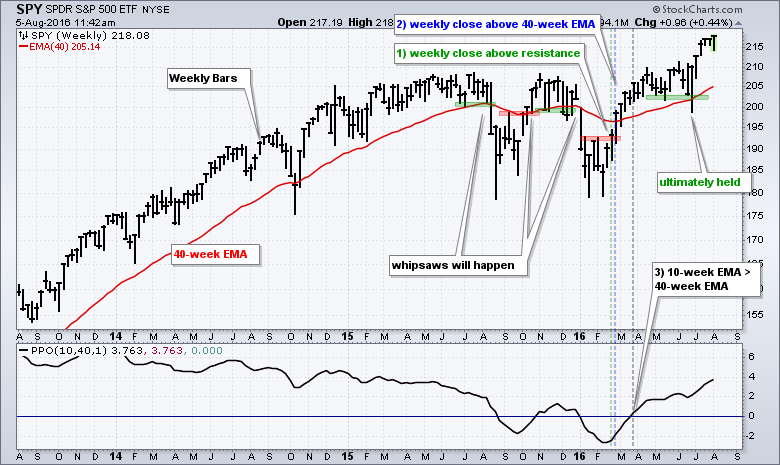
The chart above shows support levels marked with green and resistance levels marked with red. A weekly close below support is negative and a weekly close above resistance is positive. Chartists can combine these breaks with the EMAs for a three step process to trend identification. A resistance break, close above the 40-week EMA and 10-40 EMA cross suggest that the long-term trend is up. Conversely, a support break, a close below the 40-week EMA and a 10-40 EMA cross suggests that the long-term trend is down.
Combined with breadth analysis, trend identification is valuable information because it establishes our directional bias and sets the tone for the broad market environment. We want to be long stocks and looking for bullish setups when the broad market environment is bullish. Furthermore, we should expect bullish resolutions more often than not and avoid short positions. We want to be out of stocks when the broad market environment is bearish. It is important to preserve capital so we are ready for the next bull market phase. Links to other articles can be found below.
These trading strategies were tested using Amibroker with the help of Cesar Alvarez of AlvarezQuantTrading.com. For more information about his testing and consulting services, click here.
****************************************
Thanks for tuning in and have a great day!
--Arthur Hill CMT
Plan your Trade and Trade your Plan
*****************************************
A Weight of the Evidence Approach using Breadth and Trend:
1) Using AD Percent to Identify Sharp Shifts in Participation
2) Using High-Low Percent for a Directional Bias
3) Using %Above 200-day to Measure Trend Participation
4) Using Price and Two Key EMAs to Define the Broad Market Trend
ETF Master ChartPack - 300+ ETFs organized within various ChartLists.
Follow me on Twitter @arthurhill - Keep up with my 140 character commentaries.
