Three Sector Breaks Remain in Play .... The Three Big Laggards - XLV XLP XLU .... Tech, Finance and Energy Continue to Lead .... RRG Reflects Current Sector Rotations .... NatGas Continues to Lead Oil .... Webinar Video .... //// ....
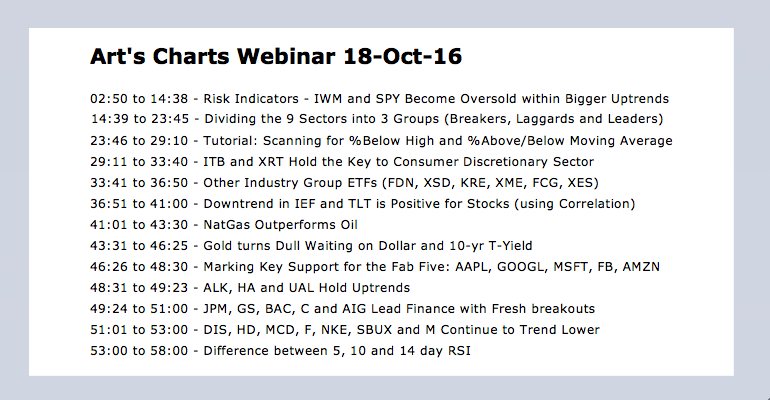
Click here for the webinar video.
The nine sector SPDRs can be divided into three groups right now: the three leaders, three that peaked in August and the three that peaked in July. Let's look at the recent breakdowns in XLY, XLI and XLB first because these breakdowns remain in play and continue to weigh on the broader market. Even though I think the S&P 500 is in a long-term uptrend and recent weakness is a correction within this uptrend, this correction will not end until some of these sectors reverse their recent breakdowns. The first chart shows the Consumer Discretionary SPDR (XLY) breaking rising wedge support with a sharp decline last Tuesday and continuing lower the last four days. The ETF is now testing the 200-day EMA (red line).

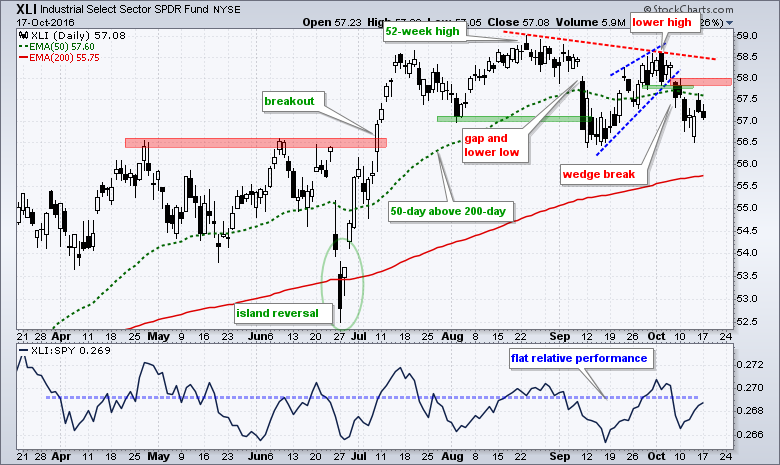
The four red annotations highlight the negative developments since August. XLY broke support with a gap down in early September, formed a lower high in mid October and broke wedge support last week. Fourthly, the ETF shows relative weakness because the price relative has been trending lower for months. The next chart shows the Industrials SPDR (XLI) with a similar negative sequence. XLI, however, is not underperforming SPY because the price relative (XLI:SPY ratio) has been flat since April.
The Materials SPDR (XLB) also formed a lower high and broke down last week. Despite recent weakness, the blue oval shows XLB gapping below the 200-day EMA on Thursday and gapping back above this level on Friday. I do not think the 200-day EMA marks support necessarily, but there is clearly a short-term reversal in the making here. Look for follow through above 47 to complete the reversal. Instead of marking support and resistance, I use EMAs to compare charts and relative price levels. I will explain this further in today's webinar.

The Three Big Laggards
The next three sectors peaked from early July to early August and these are currently the weakest of the nine. The first chart shows the Utilities SPDR (XLU) peaking in early July and moving below the 200-day EMA in early October. The ETF managed to firm in the 47-47.5 area and bounce last week, but I would not take this bounce seriously until XLU breaks above 48.5 (red zone). I would also watch the 10-yr T-Yield ($TNX) because XLU and $TNX are negatively correlated.

The Consumer Staples SPDR (XLP) peaked in mid July and broke flag support twice as it fell below its 200-day EMA. Even though XLU and XLP are part of the stock market and weakness does weigh, I am not too concerned because these two are defensive sectors. Money rotating out of defensive sectors could find its way into the offensive sectors and this would be positive for the broader market.

The HealthCare SPDR (XLV) peaked on August 1th, bounced off the 200-day EMA in mid September and broke down again in late September. The ETF fell below the 200-day EMA on Tuesday and is the furthest below the 200-day EMA (of the nine sector SPDRs).

Even though these six sectors are down over the last few months and lagging, note that the 50-day EMA is above the 200-day EMA for ALL six. Also note that all six recorded 52-week highs this summer, which was not all that long ago. XLP, XLV and XLU are the furthest from these highs and these three bore the brunt of recent selling pressure. However, note that XLU is still up 13.64% year-to-date and the second best performing sector this year. XLV is the only sector that is down year-to-date.
Tech, Finance and Energy Continue to Lead
It is a motley crew, but the Technology SPDR (XLK), the Finance SPDR (XLF) and the Energy SPDR (XLE) are the clear market leaders right now. Together, these three account for around 47% of the stock market. A bear market is highly unlikely as long as these three hold up. The chart below shows XLK failing to hold a triangle breakout and breaking below the early October low. This is a minor support break at best and the bigger up trend holds more sway. The blue oval shows a gap down, doji and gap up last week. This is a short-term reversal in the making and a break above 47.7 would be short-term bullish.

XLF is at its moment-of-truth because it fell back to the breakout zone. Overall, XLF broke flag resistance in early August and fell back to the 19.2-19.4 area last week. This breakout zone turns into the first support zone to watch.

XLE remains within a clear rising channel the last six months. The ETF hit a new high on October 10th and fell back over the last five days. This puts the ETF back in the middle of the channel and it could find support here for its next move higher.

RRG Reflects Current Sector Rotations
The Relative Rotation Graph (RRG) below shows XLK, XLF and XLE in the leading quadrant (green). XLI also poked its head in this quadrant recently. XLP, XLU, XLV and XLY are in the lagging quadrant (red). XLB also moved into this quadrant over the last few weeks.

NatGas Continues to Lead Oil
The next chart shows the USO Oil Fund (USO) in the top window and December Crude (^CLZ16) in the bottom window. December crude corrected in June-July, reversed in early August and broke out in early October. Even though crude is right back where it was in mid May ($50), the breakout is bullish and this should be positive for oil-related stocks. I am marking key support at 44.


NatGas is even stronger than oil. December NatGas (^NGZ16) broke out in September, fell back and then surged to its highest level of the year last week. The August-September lows mark support in the 3-3.1 area.
******************************************************
Measuring Risk On-Risk Off - Using charts to quantify stock, economic and credit risk.
PPO Trading Strategy - How to use 3 PPOs to develop a trend-reversion trading strategy.
Long-term Trend Indicators - Using the PPO, EMA Slope and CCI to determine the trend.
ETF Master ChartPack - 300+ ETFs organized in a Master ChartList and in individual groups.
Follow me on Twitter @arthurhill - Keep up with my 140 character commentaries.
****************************************
Thanks for tuning in and have a good day!
--Arthur Hill CMT
Plan your Trade and Trade your Plan
*****************************************
