A Negative Week, but a Positive Year .... Broader Market is Seriously Mixed .... S&P 500 Stalls above its Breakout Zone .... Small-caps and Mid-caps Sport Corrective Patterns .... Breadth Indicators Can Foreshadow Significant Changes .... Large-cap Breadth Remains Bullish .... Weight of the Evidence Table.... //// ....
A Negative Week, but a Positive Year
It was a negative week for stocks with the major indexes losing between one and two percent. Large-caps and mid-caps held up relatively well as the S&P 500 lost just .96%, the S&P MidCap 400 lost .92% and the Nasdaq 100 lost 1.15%. Small-caps fared worse as the Russell 2000 declined 1.95%.
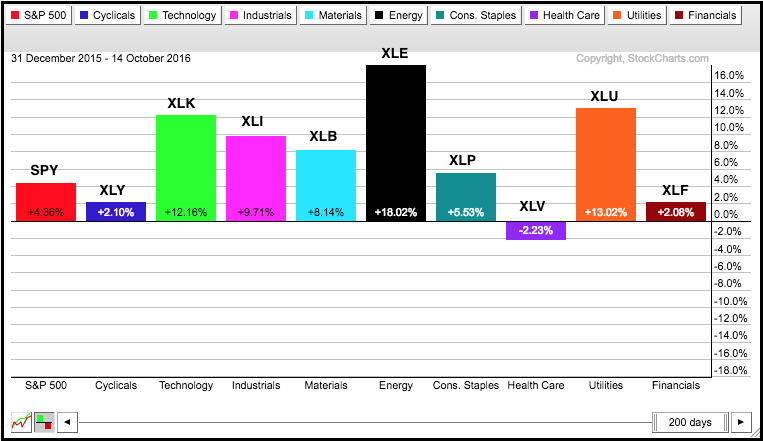
Seven of the nine sectors were down with healthcare stocks leading the way. The HealthCare SPDR (XLV) lost 3.13% and the Biotech SPDR (XBI) was pounded for a 7.16% loss. My guess is that the elections are weighing on healthcare stocks. Healthcare accounts for 14.5% of the S&P 500 and is the second biggest sector. Elsewhere, the sector losses were rather modest as consumer discretionary, finance, energy and materials lost around 1%. The chart below shows year-to-date performance for the nine sector SPDRs and XLV is the only one with a loss. XLU is still the second best performing sector over the last 200 days and technology is in third place.
The sector picture changes dramatically when we look at performance over the last three months. Notice that only three of the nine are up with technology and finance leading. Utilities, healthcare and staples are down the most. The net result, six down and three up, weighed on the S&P 500 SPDR because it is down 1.42% since mid July.

Broader Market is Seriously Mixed
The broader market is also incredibly mixed over the last three months. The PerfChart below shows eight major index ETFs with four up and four down. The Russell 2000 iShares, Nasdaq 100 ETF, Nasdaq 100 EW ETF, and Russell MicroCap iShares are up, while the S&P 500 SPDR, Dow Diamonds, S&P SmallCap iShares and S&P MidCap SPDR are down. Basically, small-caps and techs are strong, while large-caps and mid-caps are weak.

The mixed performance and sideways price action in the S&P 500 SPDR indicates that the market is in a corrective phase right now. I say "corrective" because the S&P 500 hit an ALL TIME high in August and is currently less than 3% from this high. Similarly, the S&P Small-Cap 600 and S&P MidCap 400 also hit ALL TIME highs in August and both are less than 4% from these highs. The daily price action may seem ugly or confusing, but the weekly charts show corrective patterns that look like normal pullbacks within an uptrend. At this point, I still expect a bullish resolution to these patterns because the broad market environment remains bullish. Expectations are always subject to change so I will show what it would take for me to move from stock market bull to stock market bear.
S&P 500 Stalls above Breakout Zone
Let's start off with some weekly charts for a little perspective. The S&P 500 remains in a long-term uptrend as it consolidates above the breakout zone. First, note that the index broke out to a new all time high in July and recorded more new highs in August, just two months ago. Second, the PPO (10,40,1) turned positive in late March and this means the 10-week EMA is above the 40-week EMA. Third, the index has not closed below the 40-week EMA since late February. The long-term evidence is clearly bullish and this favors further gains in the coming weeks.

Short-term, the index consolidated above the breakout zone with a falling wedge. The short-term trend is down as long as the wedge falls, but I view this as a bullish continuation pattern because it represents a consolidation after a sharp advance (and breakout). The index is testing the breakout zone again this week and I am marking key support at 2100. A close below this level would break support and exceed the 40-week EMA. I would then re-evaluate my bullish stance. Until then, chartists can look for an upside breakout at 2175 to reverse the two month downtrend and signal a continuation of the bigger uptrend.
Small-caps and Mid-caps Sport Corrective Patterns
Chartists can look to small-caps and mid-caps for early signs of a regime change in the broader market. I do not see any warning signs right now because both are in uptrends and the pullbacks look like corrections. The charts below shows the S&P Small-Cap 600 and the S&P MidCap 400 breaking down in early December and both PPOs in negative territory in December. These breakdowns preceded the broad market decline in January. As the charts now stand, $MID and $SML are above their 40-day EMAs and the PPOs are firmly positive. $MID formed a falling wedge after its high and a breakout at 1560 would signal a resumption of the bigger uptrend. $SML formed a small triangle and a breakout at 760 would signal a resumption of the bigger uptrend.


Breadth Indicators Can Foreshadow Significant Changes
The chart below shows the S&P Small-Cap 600 with three breadth indicators. The red arrows show an initial bearish signal and the green arrows show an initial bullish signal. Signals after these initial signals just affirm the existing signal so I am not marking them. The 10-day EMA of AD Percent triggers bullish with a move above +30% and bearish with a move below -30%. High-Low Percent triggers bullish with a move above +10% and bearish with a move below -10%. The %Above 200-day EMA triggers bullish with a move above 60% and bearish with a move below -40%. I set these levels to identify meaningful shifts in breadth and weed out insignificant moves (short-term noise). The weight of the evidence is bullish when at least two of these three indicators are on bull signals (green arrows) and bearish when two of the three are on bear signals (red arrows).
I am starting with small-cap breadth to highlight the early warning signals in July 2015 and December 2015. Notice how AD Percent and High-Low Percent triggered bearish in July 2015 (two bearish signals). These signals were followed by the August plunge and bearish signals in the other two indicators. There was a bounce in October-November that caused AD Percent to trigger bullish, but this signal was NOT confirmed with bullish signals in High-Low Percent and the %Above 200-day EMA. These non-confirmations provided another warning. AD Percent then triggered bearish with a plunge below -30% in early December. The weight of the evidence was clearly bearish by early December and this preceded the January plunge.

The evidence started turning bullish again in early March when AD Percent triggered bullish (green arrow) and became completely bullish when High-Low Percent exceeded +10% on June 8th. The indicators have weakened over the last few weeks, but remain well above levels that would trigger bearish signals. I do not want to front run a signal and will simply stay bullish until there is evidence to the contrary.
The next chart shows mid-cap breadth. Starting on the left, notice that all three breadth indicators triggered bearish in August and mid-caps did not provide an early warning in the summer of 2015. AD Percent rebounded and triggered bullish in early October, but this signal was NOT confirmed with bullish signals in High-Low Percent or %Above 200-day EMA. These non-confirmations provided an early warning in December 2015 and stocks subsequently plunged the following January.

The mid-cap breadth indicators turned bullish in March with AD Percent triggering first, %Above 200-day EMA second and High-Low Percent third. As with small-cap breadth, I see some weakening over the last few weeks, but I do not see any bearish signals and will remain bullish until actual signals appear.
Large-cap Breadth Remains Bullish
The large-cap breadth indicators (S&P 500) triggered bearish with the August plunge, bullish with the October surge and bearish with the January plunge. There was not much foreshadowing going on here so we are best to stick with small and mid cap breadth for early warnings. High-Low Percent and %Above 200-day EMA triggered bullish in March, but AD Percent fell .30 short of a bullish signal (29.70). AD Percent caught up in late June and all three indicators are currently bullish. Again, I see some weakening since late September, but I have yet to see bearish signals and will remain bullish until then.

Weight of the Evidence Table
The table below shows the current status for the breadth and trend indicators. Note that I am using the 5-day EMA and 200-day EMA to define the trend. I prefer a 5-day EMA because it smooths the closing prices enough to reduce some whipsaws. The table is completely green right now and I will not turn bearish until at least half of this table turns red. I will update the sector table on Monday.

******************************************************
Measuring Risk On-Risk Off - Using charts to quantify stock, economic and credit risk.
PPO Trading Strategy - How to use 3 PPOs to develop a trend-reversion trading strategy.
Long-term Trend Indicators - Using the PPO, EMA Slope and CCI to determine the trend.
ETF Master ChartPack - 300+ ETFs organized in a Master ChartList and in individual groups.
Follow me on Twitter @arthurhill - Keep up with my 140 character commentaries.
****************************************
Thanks for tuning in and have a good day!
--Arthur Hill CMT
Plan your Trade and Trade your Plan
*****************************************
