Setting the Market Environment with One Chart .... Marking First Support for SPY .... QQQ Breaks out of Consolidation .... Tech Stocks are Still Leading ..... XLV Follows Through on Weekly Hammer .... Biotech ETFs Attempt to Firm .... //// ....
I am starting with my most important chart for the stock market. This is my go-to chart for defining the broad market environment: bull market or bear market. In a bull market I want to be .... long stocks, looking for bullish setups, using pullbacks as opportunities and ignoring bearish patterns. I want to be out of stocks in a bear market. It is that simple. The chart below shows the S&P 500 and three broad breadth indicators to define the broad market environment.
Setting the Market Environment with One Chart
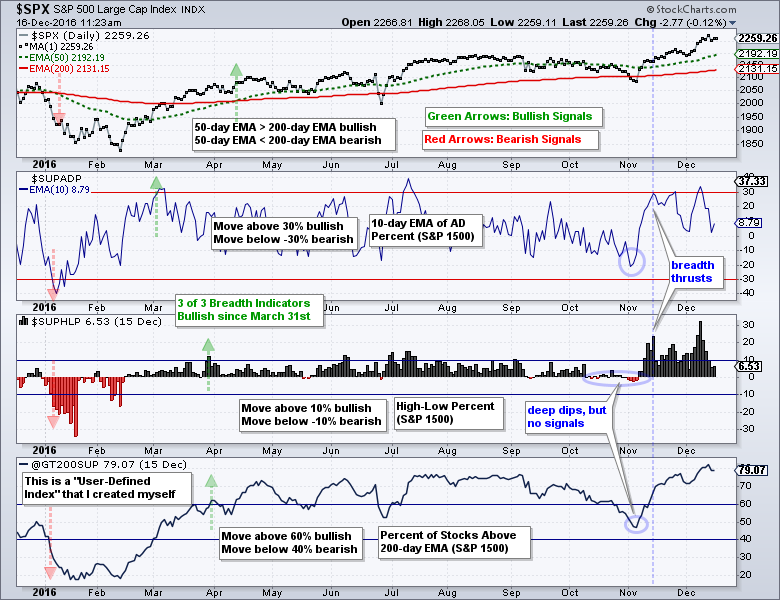
The last indicator (@GT200SUP) on the chart above was created with a "user-defined index". I created this index with data from the S&P 500 %Above 200-day EMA (!GT200SPX), Mid-Cap %Above 200-day EMA (!GT200MID) and Small-Cap %Above 200-day EMA (!GT200SML). Click here to learn how to create a user-defined index.
Eight possibilities:
- Bullish: 10-day EMA of S&P 1500 AD Percent breaks above +30%
- Bullish: S&P 1500 High-Low Percent breaks above +10%
- Bullish: S&P 1500 %Above 200-day EMA breaks above 60%
- Bullish: 50-day EMA of S&P 500 is above 200-day EMA
- Bearish: 10-day EMA of S&P 1500 AD Percent breaks below -30%
- Bearish: S&P 1500 High-Low Percent breaks below -10%
- Bearish: S&P 1500 %Above 200-day EMA breaks below 40%
- Bearish: 50-day EMA of S&P 500 is below 200-day EMA
I am bullish when two of the three breadth indicators are on bull signals and bearish when two of the three breadth indicators are on bear signals. The 50-day and 200-day EMAs for S&P 500 are added for a little insurance. AD Percent triggered bullish in early March, while High-Low Percent and the %Above 200-day EMA triggered in late March. The S&P 500 triggered a golden cross in mid April and we have been in a bull market since at least mid April. The indicators dipped deep in late October and early November (blue ovals), but did not trigger bearish signals. We then saw a bullish breadth thrust in mid November (blue line) when all three indicators moved sharply higher. We can debate overbought conditions, but there is no debate on the market environment. It is a bull market and we should trade accordingly.
Marking First Support for SPY
Even though the bull market is alive and well, prices have run far and fast in a short period of time. The weekly chart shows SPY breaking out of its falling channel six weeks ago, hitting a new high in mid November and hitting new highs again the last few weeks. SPY is up over 9% from low to high and seems extended, but this condition could last a few more weeks. Notice how the ETF surged over 17% in ten weeks earlier this year. The current advance is six weeks old. Even though we all seem to know the market is ripe for a rest, nobody knows exactly when the market will pull back and how far it may pull back. I am not interested in timing or predicting a pullback, but I would become very interested should a pullback occur. The green shading marks my first support zone to watch in the 218-220 area.

QQQ Breaks out of Consolidation
QQQ is still lagging SPY, but by no means bearish. After hitting new highs in July/August, the ETF moved into a consolidation pattern and recorded more new highs in October. QQQ broke out of the consolidation this past week with a move above 120 and another new high. In contrast to SPY, the September-October lows mark a clear support zone in the 113-114 area.

Tech Stocks are Still Leading
Even though the finance, energy and industrials sectors are grabbing most of the headlines these days, the tech sector is doing just fine with QQQ, the Nasdaq 100 EW ETF (QQEW), the Technology SPDR (XLK) and the EW Technology ETF (RYT) hitting new highs this week. In addition, the Cloud Computing ETF (SKYY) and Semiconductor SPDR (XSD) hit new highs. The charts below show the November lows marking the first important support levels to watch.


XLV Follows Through on Weekly Hammer
Despite a new high and leadership from the Technology SPDR (XLK) this week, note that the HealthCare SPDR (XLV) is the best performing sector so far this week. The chart below shows XLV with a ~20% surge from mid February to early August and then a ~61.8% retracement of that advance. This is advance-decline sequence is the most important aspect of this chart. Why? Because an uptrend should consist of two steps forward and one step backward. This advance-decline sequence still fits that mold and upside breakout would signal a continuation of the prior advance.

More recently, the ETF surged in early November with a long white candlestick, fell back into early December and then formed a long hammer last week. This shows a deep dip during the week and a recovery to close near the high of the week. XLV is following through on the hammer with a big move this week. Also notice that the PPO (5,30,5) moved above its signal line this week.
Biotech ETFs Attempt to Firm
Biotechs are a big part of the HealthCare SPDR (XLV) so breakouts in the Biotech iShares (IBB) and Biotech SPDR (XBI) would help the healthcare sector. XBI remains in an uptrend since February and the 10-week EMA is above the 40-week. The ETF surged in early November and then pulled back the last five weeks. XBI is making an attempt to firm here and chartists should watch for a break above 65.

IBB is not as strong as XBI because its 10-day EMA is below the 40-week EMA. Nevertheless, there is a slight uptrend working since June and the stock could formed a weekly bullish engulfing this week.

******************************************************
Spotting Pullbacks and Upturns within an Uptrend using RSI and MACD Histogram.
Defining Bull and Bear Market Environments with Breadth Indicators (plus video).
Backtesting Different Moving Average Pairs with SPY, QQQ and IWM.
ETF Master ChartPack - 300+ ETFs organized in a Master ChartList and in individual groups.
Follow me on Twitter @arthurhill - Keep up with my 140 character commentaries.
****************************************
Thanks for tuning in and have a good day!
--Arthur Hill CMT
Plan your Trade and Trade your Plan
*****************************************
