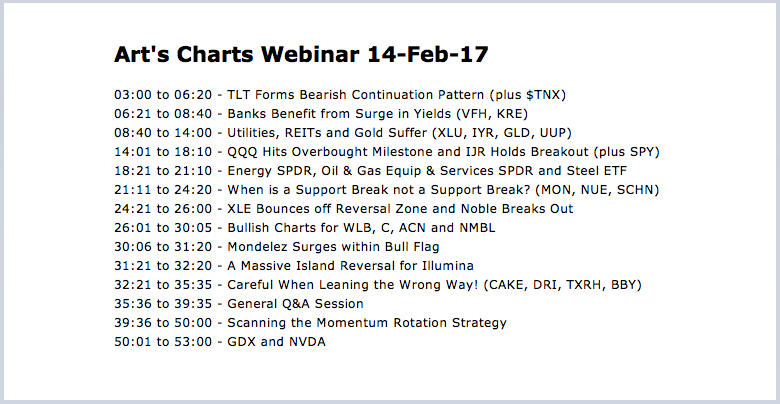
TLT Forms Bearish Continuation Pattern
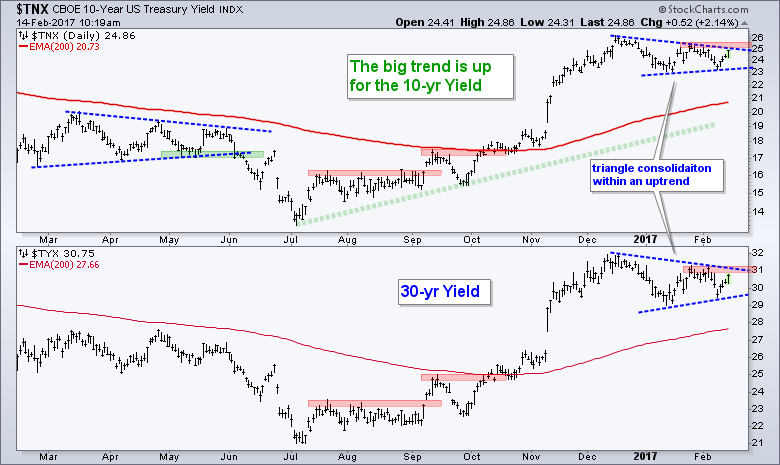
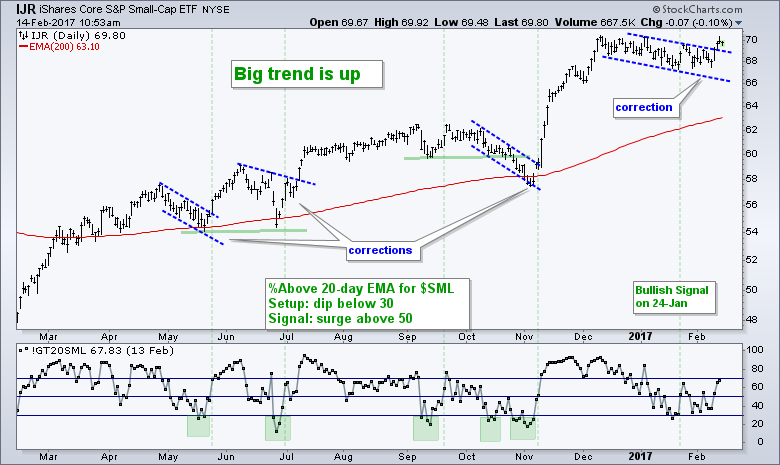
There is not much change in the broad market environment. The long-term trends are up, but SPY and QQQ are looking extended and ripe for a rest. IJR already got its rest and broke out on Friday to end its corrective period. This pits large-caps (SPY and QQQ) against small-caps (IJR). Mid-caps are somewhere in the middle because MDY hit 52-week highs over the last two days. Today we are seeing a sharp decline in the 20+ YR T-Bond ETF (TLT) and a sharp rise in the 10-yr T-Yield ($TNX). Money moving out of bonds could find its way into stocks and keep the rally going. The rise in Treasury yields is definitely fueling the Regional Bank SPDR (KRE) and the Finance SPDR (XLF). The first chart shows TLT forming a triangle within a long-term downtrend. This is a bearish continuation pattern and a break below 118 would signal a continuation lower.
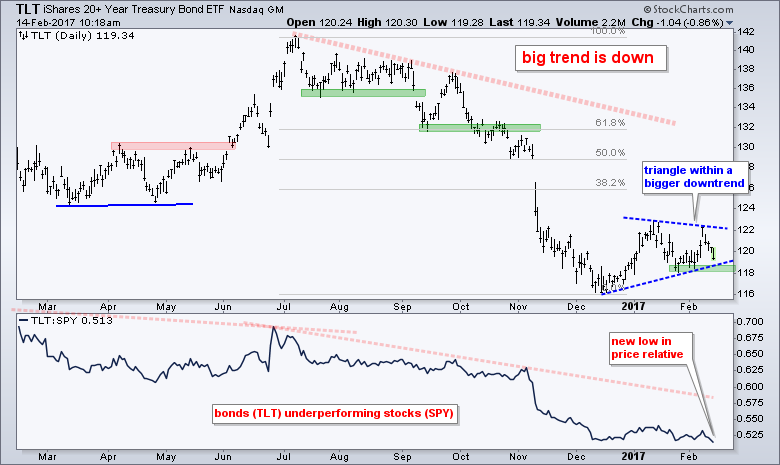
The next chart shows the 10-yr T-Yield and the 30-yr T-Yield ($TYX) forming triangles within bigger uptrends. Both bounced the last four days and they are on the verge of upside breakouts.
Banks Benefit from Surge in Yields
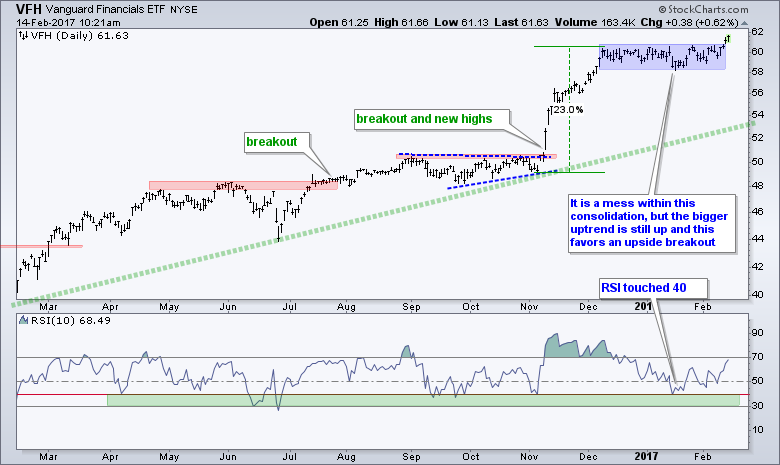
The next chart shows the Vanguard Financials ETF (VFH) breaking out of its consolidation on Monday and hitting a new high today.
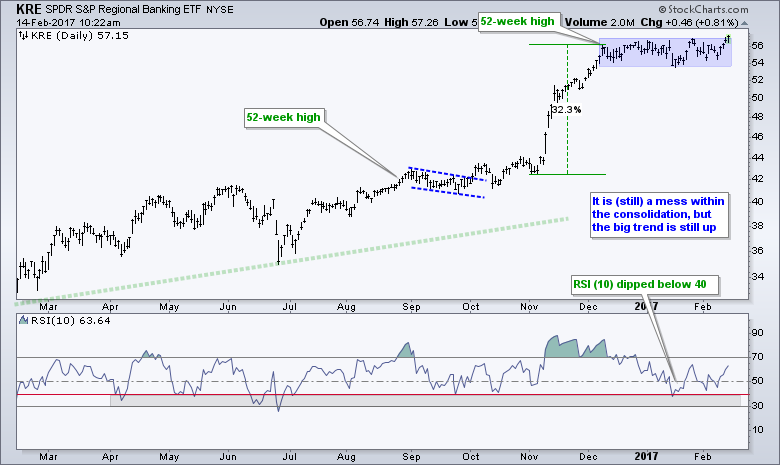
The Regional Bank SPDR (KRE) is also on the move with a break above consolidation resistance and a new high today.
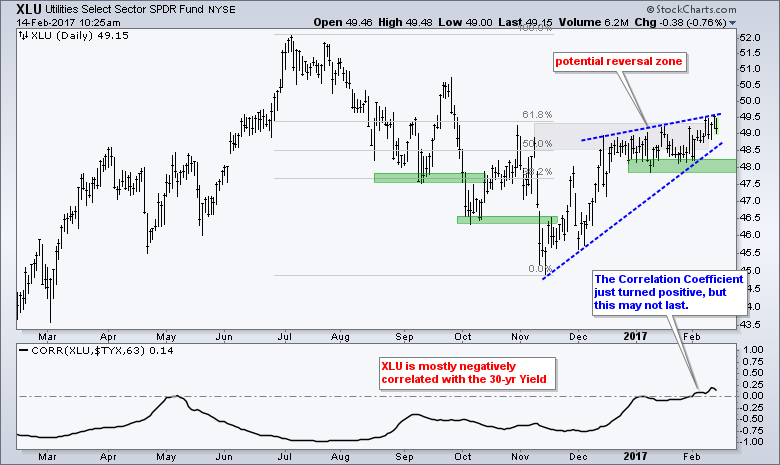
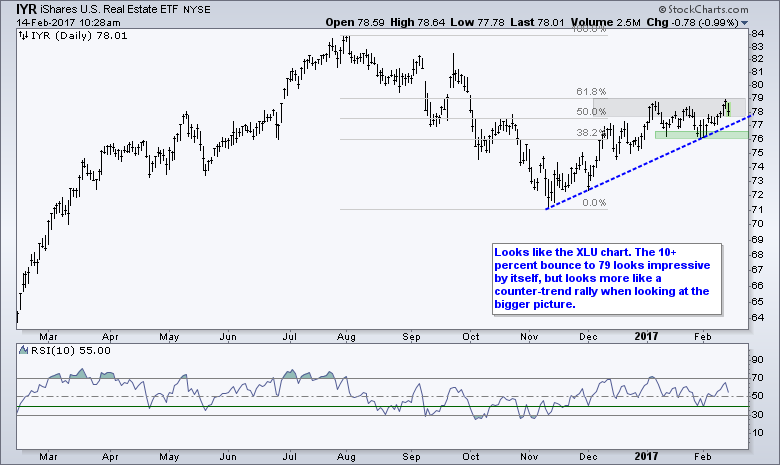
Utilities and REITs React Negatively to Surging Yields
With the sharp rise in the 10-yr T-Yield today, we can immediately see which groups are negatively correlated to Treasury yields. These include the Utilities SPDR (XLU) and the REIT iShares (IYR). The first chart shows XLU with a rising wedge and I consider this bounce a correction within a bigger downtrend. Also notice that XLU retraced around 61.8% of the prior decline. The pattern and the retracement are typical for bear market rallies. A break below the January lows would reverse this advance and signal a continuation of the bigger downtrend. The second chart shows IYR with a similar setup.
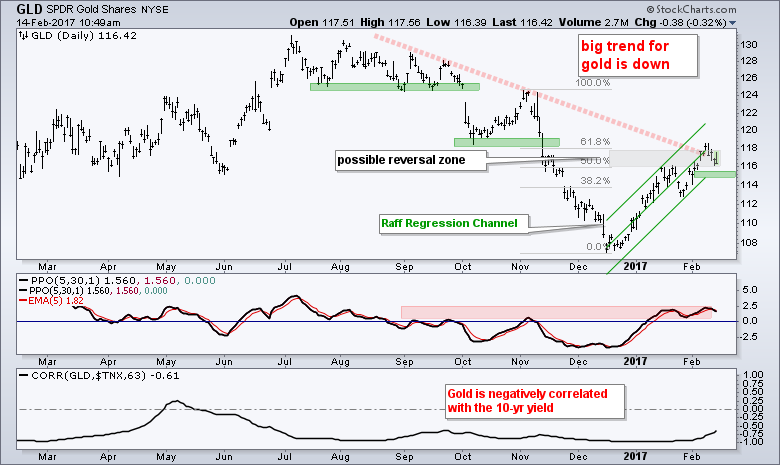
The Dollar is also getting a bounce today and this is a double whammy for gold. The next chart shows the Gold SPDR (GLD) hitting a potential reversal zone last week and falling this week. I view the bounce to 118 as a counter-trend move or bear market rally in gold. The Raff Channel marks support around 115 and a break here would reverse the upswing.
QQQ Hits Overbought Milestone
QQQ hit yet another new high on Monday and is now up almost 3% in nine days. This move pushed 10-day RSI to its highest level since July 3rd, 2014. A high reading in RSI does not mean much on its own. However, notice that RSI has been hovering around the 70 area for 22 trading days, which means RSI has been staying "overbought" for over four weeks. The correction is not here yet, but here are two things to watch. First, look for a break below the early February low in 10-day RSI. Second, look for a break below 50. I marked the last two times RSI hovered around 70 and then broke down.
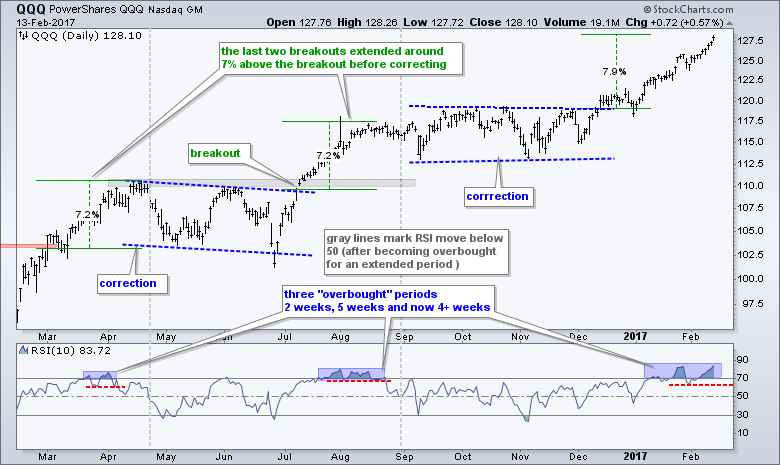
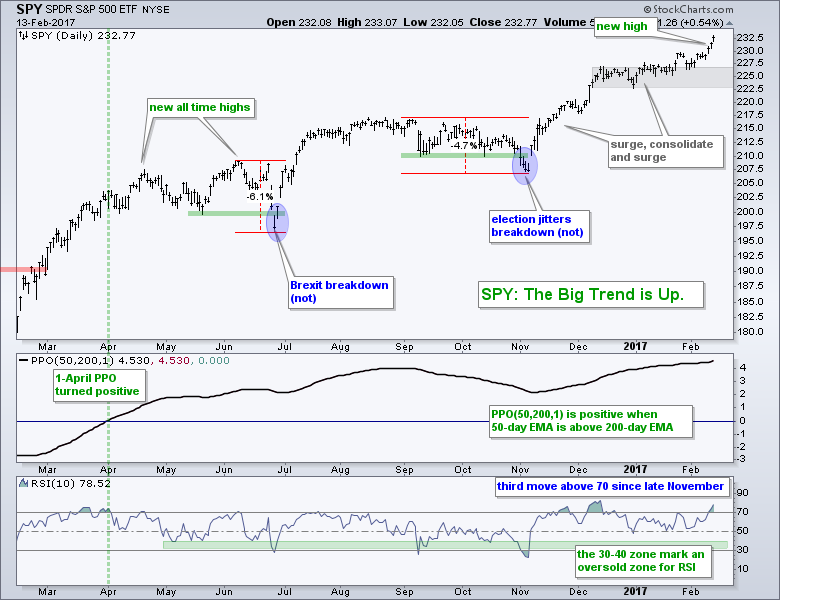
SPY also hit another new high and the ETF is now up a little over 2% in the last ten days. The gray zone marks the first support zone to watch should we ever see a pullback. The lower indicator window shows RSI moving above 70 for the third time since November 21st.
IJR Holds Breakout
IJR triggered a bullish breadth signal on January 24th and broke flag resistance with a surge on Friday. This breakout is clearly bullish as long as it holds. I featured this setup on January 19th and covered the signal on February 9th. The red line shows a Chandelier Exit (22,2) that chartists can consider for an exit strategy. A move below 30% in Small-Cap %Above 20-day EMA (!GT20SML) would also negate the signal.
Stocks and Trading Strategies
I covered ETFs in great detail in Saturday's Weekly Market Review & Outlook. Today I am going to focus on stocks. Note that today's webinar will cover the momentum rotation system featured on Thursday. The stocks below do not come from this scan though. Instead, I am going to explain a few different setups that I am seeing on this individual stock charts. As with the momentum rotation strategy, I have NO IDEA which setups will work and which will fail. In addition, I do not use upside projections because these are mostly guesses. Risk is really the only thing we can control. This can be done through position sizing and setting stop-losses.
Programming Note
Note that we are making some changes to the webinar schedule. In short, I will not be doing a weekly webinar anymore. I will replace Tuesday's webinar with the Weekly Market Review & Outlook (commentary and video). I am looking into the possibility of periodic webinars to cover some of the topics in the System Trader commentaries.
When is a Support Break not a Support Break?
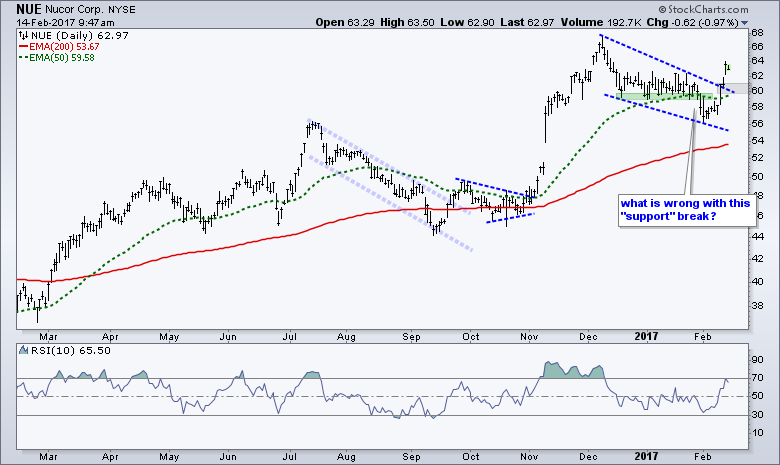
I covered the Steel ETF (SLX) over the weekend and it surged to a new high on Monday. This tells us that steel stocks are strong and leading. Within the steel group, I am seeing breakouts in Nucor (NUE) and Schnitzer Steel (SCHN). The NUE chart highlights a classic "support" break that did not amount to much. Why? Because the bigger trend was up. NUE hit a 52-week high in early December and the 50-day EMA was above the 200-day EMA. This meant the decline from 68 to 56 was a mere correction within a bigger uptrend. NUE broke out of a falling wedge the last few days and this signals a continuation of the bigger uptrend. The breakout zone around 60-61 marks the first support zone to watch on a throwback.
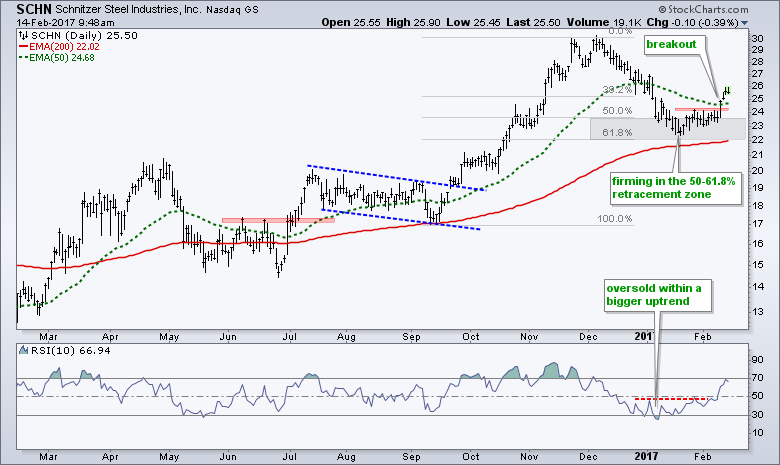
A Classic Correction for Schnitzer
SCHN sports a classic correction that retraced 50-61.8% of the prior advance and pushed RSI below 30 twice. It is often difficult to initiate a position when RSI is oversold and the knife is falling. Chartists can then wait for an RSI breakout, either above an RSI peak or above 50. These momentum breakouts sometimes preceded a breakout on the price chart.
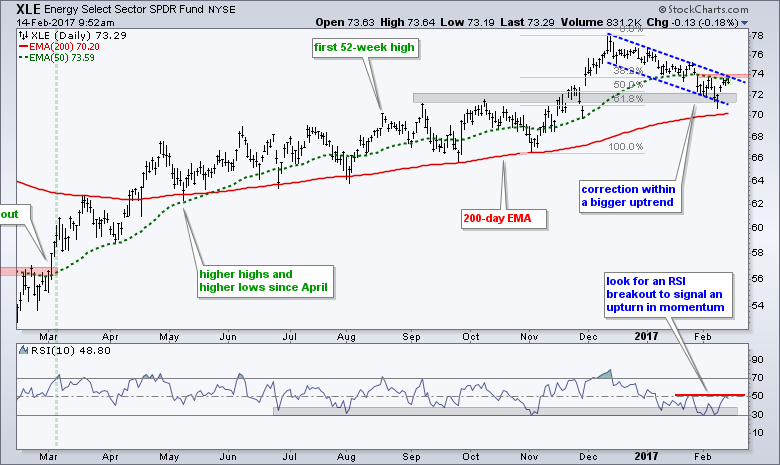
XLE Bounces off Reversal Zone
The Energy SPDR (XLE) and the Oil & Gas Equip & Services SPDR (XES) remain in corrective patterns. XLE hit its reversal zone around 72 and bounced last week. A follow through move above 74 is needed to trigger a breakout. Chartists can also watch for RSI to break above its late January high.
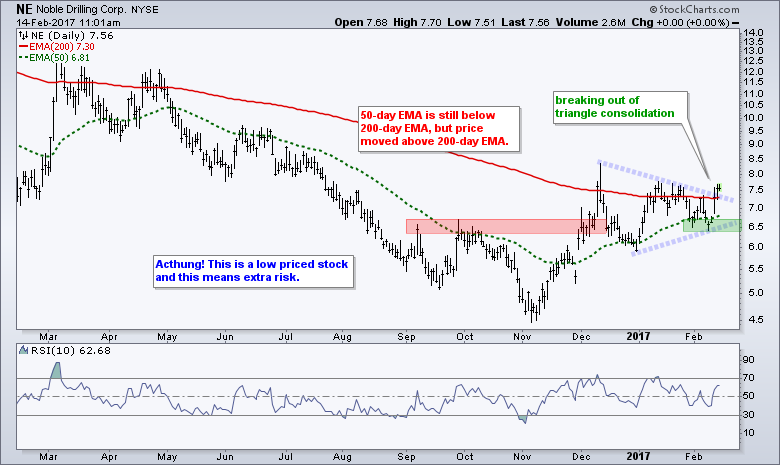
Noble Drilling (NE) remains in a long-term downtrend, but shows signs of strength as it moves above the 200-day EMA and above the triangle trend line.
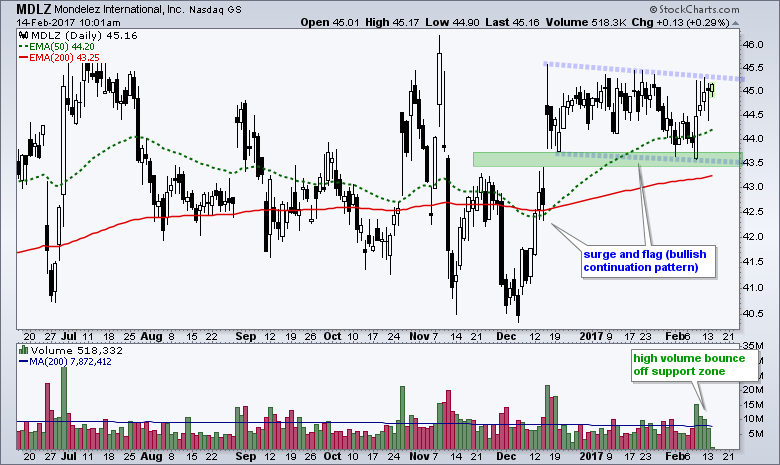
Mondelez Surges within Bull Flag
Mondelez (MDLZ) has gone nowhere for months, but the stock is showing signs of buying pressure with a surge, gap and bounce. The stock surged in mid December and gapped above 44 on big volume. MDLZ then consolidated with a falling flag the last eight weeks. Most recently, the stock surged off flag support with good volume and this bodes well for an upside breakout.
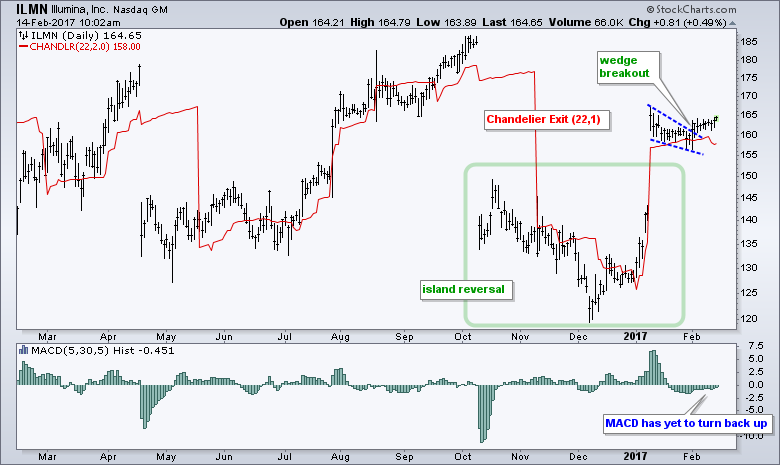
A Massive Island Reversal for Illumina
Illumina (ILMN) sports one of the biggest island reversals I have seen in a while. Notice how the stock gapped below 150 in early October, chopped around and then gapped above 150 in mid January. This created an island where short-sellers are stuck with losses. The stock corrected with a small wedge after the January surge and broke wedge resistance two weeks ago. Even though the MACD Histogram has yet to turn positive, I think this wedge breakout is bullish until proven otherwise. The red line is the Chandelier Exit (22,2).
******************************************************
Spotting Pullbacks and Upturns within an Uptrend using RSI and MACD Histogram.
Difference between EMA and SMA - Using %Above 200-day EMA for Breadth Analysis.
Backtesting Different Moving Average Pairs with SPY, QQQ and IWM.
ETF Master ChartPack - 300+ ETFs organized in a Master ChartList and in individual groups.
Follow me on Twitter @arthurhill - Keep up with my 140 character commentaries.
****************************************
Thanks for tuning in and have a good day!
--Arthur Hill CMT
Plan your Trade and Trade your Plan
*****************************************
