.... SPY Remains the Key Yardstick
.... Using the 50-day SMA to Compare Charts
.... IJR Attempts another Oversold Bounce
.... Banking Stocks Hit Support Zones (BAC, C, JPM, WFC, STT)
.... Watch TLT and $TNX for Clues on XLF
.... Technology is Still the Strongest Sector (MSFT, NVDA, QLYS) ....
SPY Remains the Key Yardstick
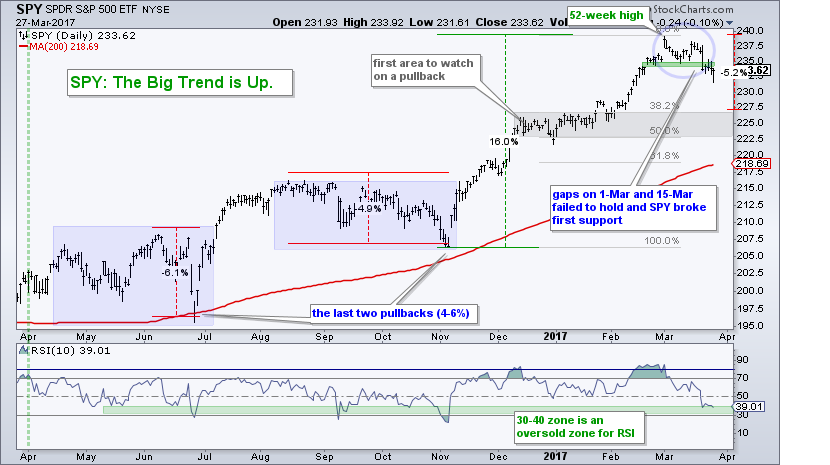
Stocks opened the day with selling pressure, quickly found their footing and recovered in time for an afternoon nap as trading turned flat. Small-caps and large-techs led the recovery with the S&P SmallCap iShares (IJR) and Nasdaq 100 ETF (QQQ) finishing positive on the day. The Dow Diamonds (DIA) and S&P 500 SPDR (SPY) finished slightly lower. Despite Monday's rebound and small-cap leadership (for a day), nothing has changed regarding my call for a correction in the coming weeks. See Wednesday's note and the Weekly Market Review & Outlook for details. The chart below shows SPY, which serves to illustrate my base-case for the stock market. The gray area marks the first zone to watch on a pullback.
Using the 50-day SMA to Compare Charts
The chart below shows a broad range of ETFs with the 50-day SMA for reference. I do not think moving averages offer support or resistance levels, but they can be used to compare performance and generalize the trend. The 50-day SMA is a medium-term indicator. The trend is generally up when above and down when below. Note that SPY and QQQ are above, but IJR and MDY are below. Large-caps and large-techs are holding up better than small-caps and mid-caps.
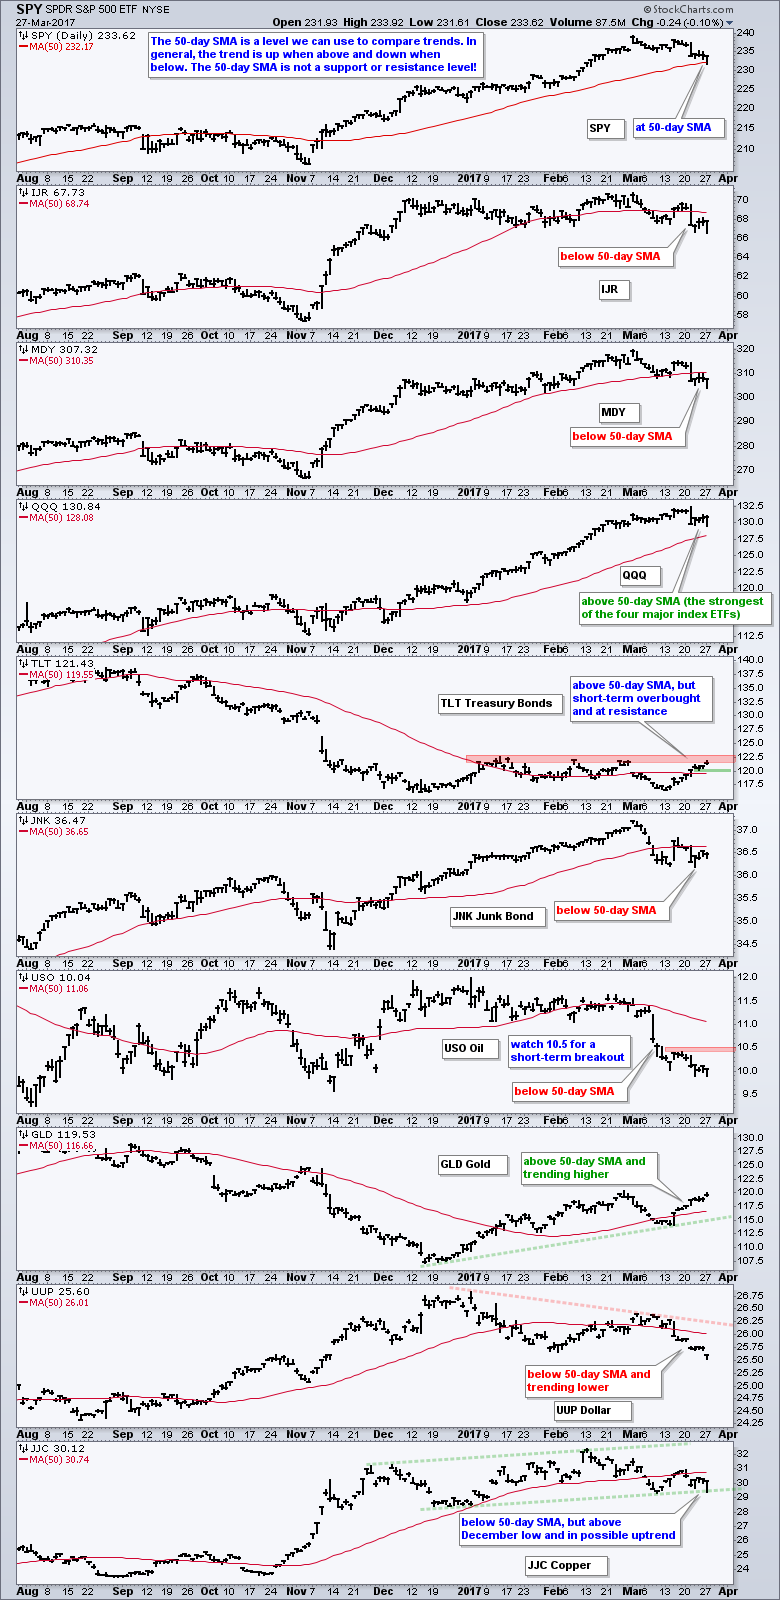
TLT is above the 50-day SMA, but in a trading range and near range resistance. A break below 120 would reverse the upswing and this would be positive for banks. USO remains weak with short-term resistance set at 10.50. A break above this level is needed before getting interested in energy-related stocks and ETFs. GLD is trending up as the Dollar trends down. Note, however, that it could still be a bear market rally for GLD and a correction for the Dollar.
IJR Attempts another Oversold Bounce
The chart below shows the S&P SmallCap iShares (IJR) becoming short-term oversold last week as RSI(5) dipped below 30 for the second time in four weeks. RSI(5) is part of a mean-reversion strategy that I laid out in a System Trader article earlier this month. Note that these systems do not try to time corrections, do not use breadth indicators and do not THINK before acting. The system buys when the long-term trend is up for the S&P 500 (broader market) and RSI(5) for IJR moves above 30 (oversold bounce). It sells when IJR crosses below the Chandelier Exit. It is a short-term mean-reversion strategy. Thus, this system is long until IJR moves below the Chandelier Exit (red). IJR must first, of course, move above the Chandelier Exit, which will fall when the 22-day high falls (see the ChartSchool article for details).

Banking Stocks Hit Support Zones (BAC, C, JPM, WFC, STT)
The finance sector led the way lower in March as banking stocks got crushed. The rise in the 10-yr T-Yield ($TNX) may have had something to do with this so chartists should watch TLT closely. Note that yields and bonds move in opposite directions. A short-term reversal in TLT would signal a short-term reversal in yields and this could boost banks. In the meantime, big bank stocks are short-term oversold and in potential reversal zones (support). The red lines mark short-term resistance on the first four charts. Note that earnings reports begin on April 13th with JP Morgan and Citigroup.


Watch TLT and $TNX for Clues on XLF
It's now time for the two-handed technical analyst. On the one hand, the finance sector is leading lower in March and I am calling for a correction in the stock market. This argues for the sidelines or downside protection. On the other hand, the 50-day EMA is above the 200-day EMA for the S&P 500 and we are still in a bull market - even with a possible correction looming. These banking stocks are also in long-term uptrends and they are oversold. The System Trader in me sees a mean-reversion bullish setup. Yep, it is a tough call. I would watch TLT for a break below 120 before considering these setups. The chart below show TLT rising, XLF falling and $TNX falling the last two weeks.

Technology is Still the Strongest Sector (MSFT, NVDA, QLYS)
The S&P 500 SPDR is down .78% this month and six of the nine sectors are down. The Technology SPDR (XLK) is up 1.33% month-to-date and leading the market. This does not make it immune to a correction, but I am still looking in this sector for potential bullish setups. The first chart shows Microsoft in a long-term uptrend and holding within an ascending triangle. It is a boring uptrend for sure, but the ascending triangle is a bullish continuation pattern and a breakout would print a new high.

I highlighted NVDA last week as it bounced off the support zone. The stock stalled the last five days with a bull flag and a breakout at 110 would be bullish.

QLYS is already trading above last week's high as it extended its bounce off broken resistance, which turned into support. The 50-day EMA is above the 200-day EMA.

******************************************************
Spotting Pullbacks and Upturns within an Uptrend using RSI and MACD Histogram.
Difference between EMA and SMA - Using %Above 200-day EMA for Breadth Analysis.
Backtesting Different Moving Average Pairs with SPY, QQQ and IWM.
ETF Master ChartPack - 300+ ETFs organized in a Master ChartList and in individual groups.
Follow me on Twitter @arthurhill - Keep up with my 140 character commentaries.
****************************************
Thanks for tuning in and have a good day!
--Arthur Hill CMT
Plan your Trade and Trade your Plan
*****************************************
