.... Big Techs Regain their Mojo
.... Finance, Healthcare, Industrials and Materials Lead
.... Short-term Yields Diverge from Long-term Yields
.... Bank ETFs Stall after Breakouts
.... Two Big Pharma Stocks: BMY and MRK
.... 3 Hospital Stocks: HCA, LPNT, THC
.... Four Networking Stocks: ARRS, CIEN, CSCO, FNSR
.... XRX Breaks Out, FEYE Forms Flag and RLGY Breaks Wedge Line ....
Big Techs Regain their Mojo
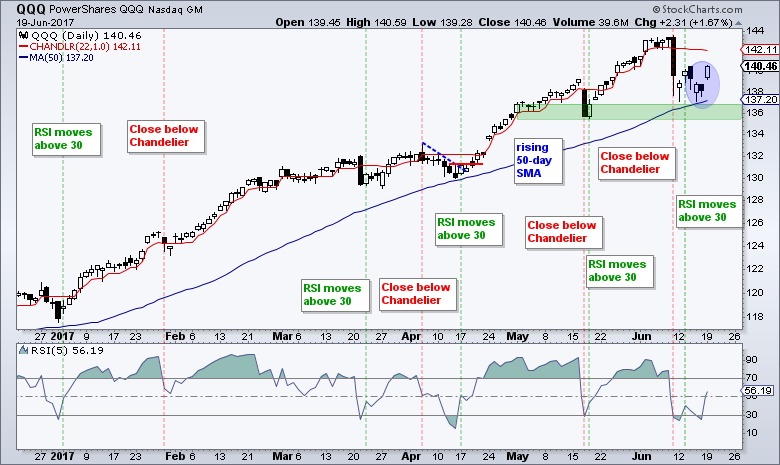
The Nasdaq 100 ETF (QQQ) was hit hard on June 9th and June 12th, but quickly found support just above the mid May low and surged with a gap yesterday. Overall, the big trend is clearly up and the ETF has been above the rising 50-day SMA since mid November. The decline to the 138 area created a short-term oversold situation as RSI(5) dipped below 30 twice. The indicator moved above 50 on Monday as QQQ gapped and closed strong. The blue oval on the chart shows a four day reversal with a gap down, two-day stall and gap up. A close below 138 would fill Monday's gap and negate the reversal.
The EW S&P 500 ETF (RSP), which represents the "average" stock in the S&P 500 never lost its mojo and hit a new 52-week high on Monday. This new high reflects broad strength in the stock market. The breakout zone in the 91.3-92 area turns into the first support zone to watch on a throwback.

Finance, Healthcare, Industrials and Materials Lead
New highs expanded in the S&P 500 with High-Low Percent for finance, healthcare, industrials and materials hitting 25% or higher. The chart below shows S&P 500 High-Low% ($SPXHLP) exceeding 15% for the first time since June 5th. XLF High-Low% ($XLFHLP) and XLI High-Low% ($XLIHLP) both exceeded +30% to lead the new high list. Healthcare High-Low% ($XLVHLP) hit +25% and XLB High-Low% ($XLBHLP) exceeded +25% for the fourth day in six. Stocks hitting new highs are clearly in uptrends and the expansion of new highs means there are plenty of stocks in uptrends right now.

Short-term Yields Diverge from Long-term Yields
There is an interesting dynamic at work in the bond market right now. The 10-yr T-Yield ($UST10Y) has been falling most of the year, but the 2-yr T-Yield ($UST2Y) has been rising. While I hate to read too much into the reasons and offer a narrative, this discrepancy is rather pronounced. The 10-yr yield could be falling because the economic indicators have been weakening over the last few months. The 2-yr yield could be rising because the Fed continues to talk hawkish. This fall in the 10-yr yield and rise in the 2-yr yield means the yield curve is tightening the two are moving closer together. Note, however, that the yield curve is FAR from inverted, which occurs when short-term yields are higher than long-term yields. As far as the stock market is concerned, I see little reason to worry as long as the 2-yr Yield is trending up and the yield curve is not inverted. The big problems start when the yield curve inverts.

Bank ETFs Stall after Breakouts
The Bank SPDR (KBE) and Regional Bank SPDR (KRE) are positively correlated to the 10-yr yield and both formed bullish pennants over the last six days. The charts below show both banking ETFs with the Correlation Coefficient ($UST10Y) in the indicator window. This indicator dipped into negative territory the last few days, but has been mostly positive the last six months. The short-term dip occurred because the banking ETFs recently surged even as the 10-yr yield fell. Perhaps this is just a short-term anomaly.

On the price charts, both ETFs surged off support in mid June. These moves broke resistance and filled the mid May down gap. KRE and KBE are now consolidating their gains with pennant formations. These are typically continuation patterns and the prior advance gives them a bullish bias. Look for upside breakouts to signal an end to the consolidation and resumption of the advance. An upturn in the 10-yr T-Yield would probably help, but further weakness in long-term yields could weigh on banks.

Two Big Pharma Stocks: BMY and MRK
With the healthcare sector leading the market, I will start with five healthcare stocks: two big pharmaceuticals and three hospitals. Bristol Meyers Squibb (BMY) was first highlighted in late May and the stock then fell sharply in early June. I am impressed with the rebound because the stock filled the 5-June gap and exceeded the 2-June high. Overall, the big trend is still down, but the falling wedge since March looks corrective. Notice that the wedge formed after a strong advance and retraced 50-61.8% of the move. BMY is currently challenging the 200-day EMA and a close above 56 would break the wedge line.

Merck (MRK) is another big pharma stock, but this one is in a long-term uptrend. The 50-day EMA is above the 200-day EMA and the stock is above the rising 200-day EMA. The stock broke out with a surge in early February and this breakout zone turned into a support zone (blue area). MRK was hit hard in early June, but is managing to hold above the support zone. Look for a breakout at 64.2 to signal strength. Chartists can also watch the PPO (5,30,5), which could be turning up.

3 Hospital Stocks: HCA, LPNT, THC
The first chart shows HCA Healthcare (HCA) with a reversal in March-April (red oval) and a decline to a support zone (blue area). The stock managed to firm in May and started working its way higher in June. Notice that MACD turned up and moved above the zero line, which means the 12-day EMA moved above the 26-day EMA. The May-June highs mark resistance at 86 and chartists can watch this level for a breakout.

The second chart shows LifePoint (LPNT) with a breakout in February and a consolidation the last three months. A triangle evolved and the stock broke out with a surge in early June. Notice that the 50-day EMA is above the 200-day EMA (long-term uptrend) and MACD is firmly positive (immediate trend is up).

The third chart shows Tenet Healthcare (THC), which is still in a long-term downtrend. A big double bottom is possible with resistance in the 22-23 area. My eyes are on the gap, wedge and wedge breakout over the last two months. THC is trying to turn it around here and the wedge breakout is bullish until proven otherwise. Look for a close below 17 to negate this breakout.

Four Networking Stocks: ARRS, CIEN, CSCO, FNSR


XRX Breaks Out, FEYE Forms Flag and RLGY Breaks Wedge Line


******************************************************
ETF Master ChartPack - 300+ ETFs organized in a Master ChartList and in individual groups.
Follow me on Twitter @arthurhill - Keep up with my 140 character commentaries.
****************************************
Thanks for tuning in and have a good day!
--Arthur Hill CMT
Plan your Trade and Trade your Plan
*****************************************
