.... Long-term Uptrends Resume (SPY)
.... Back in the Saddle without News
.... Are Rates Turning Up and Bonds Turning Down? ($TNX, TLT, IEF)
.... Regional Banks Surge (plus USB, FITB, ZION)
.... Vulcan Materials and Martin Marietta Turn Up ....
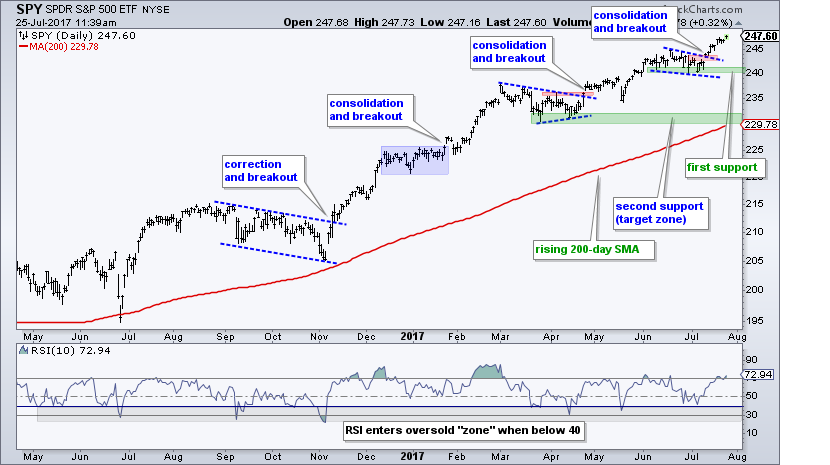
Long-term Uptrends Resume (SPY)
Stocks resumed their long-term uptrends with solid advances over the last two weeks. The S&P 500 SPDR (SPY), Nasdaq 100 ETF (QQQ) and Russell 2000 iShares (IWM) hit new highs with leadership from technology and healthcare. We are seeing more new highs today with leadership coming from the finance sector. The chart below shows SPY consolidating from early June to early July and then breaking out of this consolidation with a gap-surge on July 12th. Notice that this is at least the third consolidation and breakout sequence since January. We cannot always draw nice triangles, flags or wedges to mark these consolidations, but a trading range after a new high is a consolidation within an uptrend. Consolidations within an uptrend are bullish continuation patterns and this means we should expect a resolution in the direction of the bigger trend. With the latest breakout and new high, I will keep first support at 240-241 area and second support in the 230-232 area.
Back in the Saddle without News
In addition to spending quality time with family, vacations are also a great time to get a break from the news and the markets. We went to a nice little spot on the Costa Brava in northern Spain. The rocks, coves and beaches are great for hiking, sunning and snorkeling. Other than a few newspaper headlines in Spanish and Catalan, I went on a news and markets blackout for two weeks. Upon return, I checked my online broker to see which stops triggered and checked the charts to analyze the price action for future trades. The picture below shows Cala Belladonna and Cala Cap Roig. Simply beautiful. This will be my screen saver to help me get through tough days and tough markets!

A break from the news helps me realize just how useless and distracting the news can be. More importantly, it reinforces the supreme value of price and trend. First, news is the primary driver for our biases and too much news can lead to analysis paralysis. Less news, therefore, should translate into less bias and more focus (on the chart, of course). At the very least, time saved from news is time available for chart study. Second, the bigger trend should drive our trading bias. If the bigger trend is up, we should look for bullish resolutions to short-term pullbacks or consolidations. Even though it is difficult at times, I think it is better to just forget about seasonal patterns, short-term bearish divergences, the Fed, Washington, cycles and the length of the bull market. Focus on price and keep en open mind.
Are Rates Turning Up?
The 10-yr T-Yield ($TNX) could be putting in a significant bottom with a surge off its breakout zone. The chart below shows the 50-day EMA above the 200-day EMA to establish a long-term upward bias. The decline from March to mid June formed a wedge and $TNX broke out with a surge in late June. $TNX fell back to broken resistance with a 50-62% retracement the last two weeks and then surged on Tuesday morning. This move reverses the two-week slide and keeps the bigger wedge breakout in play.

More importantly, this points to higher yields in the coming weeks and targets a move to the March high, which is around 26. $TNX shows the 10-year yield multiplied by 10 and this targets a move to 2.6% on the 10-yr yield. I use $TNX because it is updated intraday and shows an open, high, low and close. An upturn in Treasury yields should be positive for the finance sector and negative for gold and the utilities sector.
The surge in Treasury yields is especially interesting when we look at a weekly chart for the 20+ YR T-Bond ETF (TLT) and 7-10 YR T-Bond ETF (IEF). These two retraced 50-62% of their prior declines and formed big bearish engulfing patterns five week's ago. The green zones mark support from the July lows and breaks here would reverse the seven month upswings. Such breaks would signal a continuation of the 2016 declines and target moves towards the 2015 lows.

Regional Banks Surge
The Regional Bank SPDR (KRE) has been a frustrating trade this year because it has traded flat since December. The chart below shows KRE and three regional banks (USB, FITB, ZION). KRE hit the mid 50s in mid December and is still in the mid 50s seven months later. Despite going nowhere, the overall trend is up because the ETF is above the rising 200-day EMA. As far as price patterns, KRE corrected with a big wedge into early June and broke out with a surge in mid June. The ETF formed a smaller wedge in July and broke out again with a surge today. The three stocks show similar patterns. They are above their rising 200-day EMAs and broke out of corrective patterns with today's surge.

Vulcan Materials and Martin Marietta Turn Up
VMC and MLM are in the materials sector and turning up off support. The 50-day EMA is above the 200-day EMA on both charts and they are above their 200-day EMAs. The first chart shows MLM with a possible inverse head-and-shoulders extending back to November. I am more interested in the right shoulder because it looks like a falling wedge and the stock is surging off the support zone (blue). A wedge breakout at 230 would be bullish and project a bigger breakout at 245.

The second chart shows VMC with a surge from late March to late June and a pullback into mid July. The broken resistance zone turned into a support zone around 122-125 and the stock is bouncing off this zone. Also notice that MACD is turning up and moving above its signal line.

******************************************************
ETF Master ChartPack - 300+ ETFs organized in a Master ChartList and in individual groups.
Follow me on Twitter @arthurhill - Keep up with my 140 character commentaries.
****************************************
Thanks for tuning in and have a good day!
--Arthur Hill CMT
Plan your Trade and Trade your Plan
*****************************************
