.... Sticking with a Strategy (IJR)
.... Finance Sector Rebounds
.... Broker-Dealer ETF Holds Up Better
.... TD Ameritrade and Etrade Lead Brokers
.... Industrials Sector Breaks Out
.... Airlines Finally Perk Up
.... Delta and American Lead Bounce
.... Cisco, Teradata and Skyworks ....
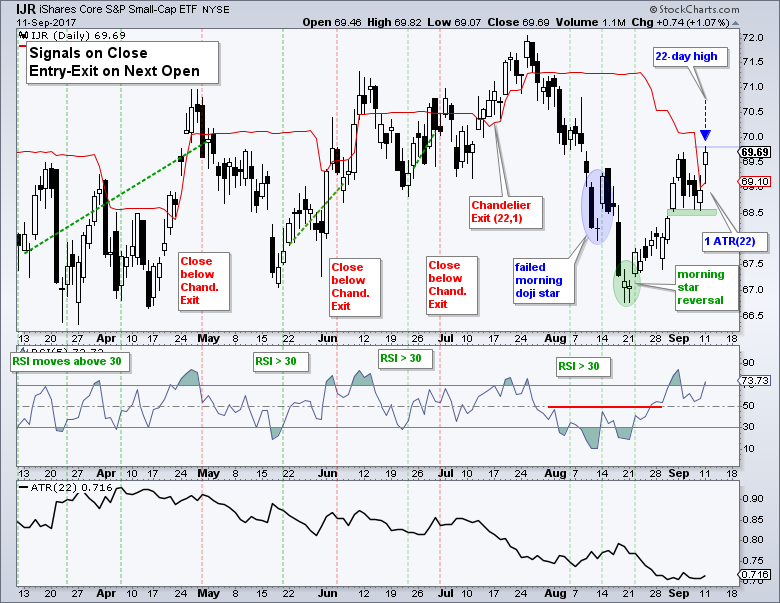
Sticking with a Strategy (IJR)
Sticking with a strategy is perhaps the hardest part about trading a strategy. A lot of time and effort goes into strategy develop, but this can easily go out the window when the emotions are running high, which happens during a drawdown period. Such is the case with the RSI(5) mean-reversion strategy for trading IJR. In bull markets, the system buys when RSI closes above 30 and sells when IJR closes below the Chandelier Exit (22,1). The system triggered a buy signal in early August and then two more buy signals as IJR fell to the 67 area. IJR formed a morning star reversal in late August and surged to a 22 day high on Monday. The ETF also crossed the Chandelier Exit and we now have a setup for the exit. A subsequent close below this exit would trigger an exit on the next open.
Finance Sector Rebounds
The Finance SPDR (XLF) led the market lower on Tues-Wed-Thurs and then led the market higher on Friday-Monday. Insurance stocks were freaking out as Irma approached and then rebounded as damage estimates subsided. XLF had a nice wedge working prior to the plunge below 24. The decline touched the 61.8% retracement and XLF formed an inside day with lows near the mid June low (green zone). The gap and surge on Monday put the wedge back in play, as if Irma never happened. Once again, I am looking for a close above 24.9 to break wedge resistance and reverse this immediate downtrend.

Broker-Dealer ETF Holds Up Better
The Broker-Dealer iShares (IAI) held up better than the Finance SPDR (XLF) and the Regional Bank SPDR (KRE) over the last six weeks. The chart below shows all three with their 200-day SMAs. XLF touched its SMA, KRE broke below it and IAI held above it. This show relative chart strength. Also notice that XLF and IAI hit new highs in late July-early August, and KRE formed a lower high. KRE is the clear laggard here. I am watching IAI for a breakout at 54 that would end the wedge correction and signal a continuation of the bigger uptrend.

TD Ameritrade and Etrade Lead Brokers
The chart below shows IAI with five of the top components. Note that Goldman Sachs (10.59%) and Morgan Stanley (9.61%) account for 20% of the ETF. GS is struggling with a flat range since April. MS is holding up better and hitting a potential reversal zone around 44. Of the discount brokers, notice that TD Ameritrade and ETrade are holding up much better than Schwab. TDAM and ETFC held well above their 200-day SMAs on the pullback and then formed higher lows from late August to early September (green lines). These two show relative strength and could lead on any upturn in the group. Watch the red lines for breakouts.

Industrials Sector Breaks Out
I was impressed with the revival of the industrials sector and the breakout in the Industrials SPDR (XLI). The chart below shows XLI hitting a 52-week high in mid July and then correcting with a decline back to the 67 area. The blue trend lines show a megaphone correction because of the sharp decline on August 17 and 18. Nevertheless, the overall decline represents a correction within a bigger uptrend and the breakouts over the last two weeks indicate that this correction is ending. The green annotations show the short-term bullish events of the last three weeks.

The indicator window shows RSI(10) moving into the 30-40 zone a least seven times over the last six months. There is no such thing as the perfect timeframe or perfect oversold settings. Indicators simply indicate. I know that XLI has corrected when RSI(10) moves in the 30-40 zone. When the bigger trend is up, which is the case now, a correction is viewed as an opportunity.
Airlines Finally Perk Up
The Airline ETF (JETS) appears to be ending its correction and turning back up. First and foremost, the long-term trend is up with the 52-week highs earlier this summer. The decline in July-August exceeded my expectations with the dip below 28, but the ETF is holding above the March low. JETS managed to firm in the 28-29 area for two weeks and break above the late August high on Monday. Notice that RSI broke above 50 and hit its highest level since mid July. The second chart shows the Transport iShares (IYT) extending on its wedge breakout.


Delta and American Lead Bounce
The next chart shows JETS with four of the top airline stocks (by market cap). United Continental (UAL) is the weakest because it broke below the March lows and has yet to break above the late August high. American (AAL) and Delta (DAL) held just above the March lows and broke their late August highs. These two appear to be the strongest. SouthWest (LUV) found support near the March lows and broke above the early August high on Monday. DAL is the only one back above its 200-day SMA.

Cisco, Teradata and Skyworks
Cisco (CSCO) has been lagging the broader market this summer because it remains well below its May high. Nevertheless, the price chart looks constructive with broken resistance turning into support and the stock bouncing off this support zone. The 50-day EMA is above the 200-day EMA so we can also make the case for a long-term uptrend.

Teradata (TDC) has been stuck below 33 all year, but looks ready to make an assault on this resistance zone. The stock broke out with a high volume surge in late July, fell back to the breakout zone in August and formed a triangle the last six weeks. TDC forged a four-candle reversal with the gap-surge up on Monday. A triangle breakout would signal a continuation of the June-July advance and project a breakout to new highs.

Skyworks (SWKS) is an Apple supplier that could be in the spotlight today. I highlighted the stock on August 15th as tested the breakout zone around 100. The stock as since broke out of the August channel. Taking a bigger look, we can see a large symmetrical triangle taking shape and the stock also broke the upper line.

******************************************************
ETF Master ChartPack - 300+ ETFs organized in a Master ChartList and in individual groups.
Follow me on Twitter @arthurhill - Keep up with my 140 character commentaries.
****************************************
Thanks for tuning in and have a good day!
--Arthur Hill CMT
Plan your Trade and Trade your Plan
*****************************************
