 |
.... Breadth Indicators Confirm Chart Strength .... SPY Stalls as QQQ Edges Lower .... Watch TLT for Clues on IJR .... Three New Highs and One Stall .... XLE Stalls, but Holds its Breakout .... Getting Perspective on XME .... Steel ETF Forms Big Continuation Pattern .... IEF and TLT Remain Divergent .... Gold Breaks as Dollar Turns Up .... US-German Spread Lifts Dollar .... Oil Corrects within Uptrend .... Discussing Correlations and Tech Weakness .... Notes from Art's Charts ChartList .... |
----- Art's Charts ChartList (updated December 8th) -----
Breadth Indicators Confirm Price Charts
Chartists can check breadth indicators to measure participation in an advance. In particular, we want to see key breadth indicators hitting new highs along with the underlying indexes. New highs in breadth confirm broad participation and reinforce the new highs in the indexes. The chart below shows the S&P 500 SPDR (SPY), the S&P 500 AD Line and the S&P 500 AD Volume Line with the 50-day EMAs and 200-day EMAs to identify golden crosses. The S&P 500 High-Low Line is shown with the 20-day EMA because it is a lot smoother than the other two indicators. Note that these are the breadth indicators for stocks in the S&P 500 - not the NYSE. First and foremost, SPY has been on a golden cross signal since April 2016. Thus, the long-term trend has been up for over 18 months and remains up. SPY also hit a new high at the end of November.
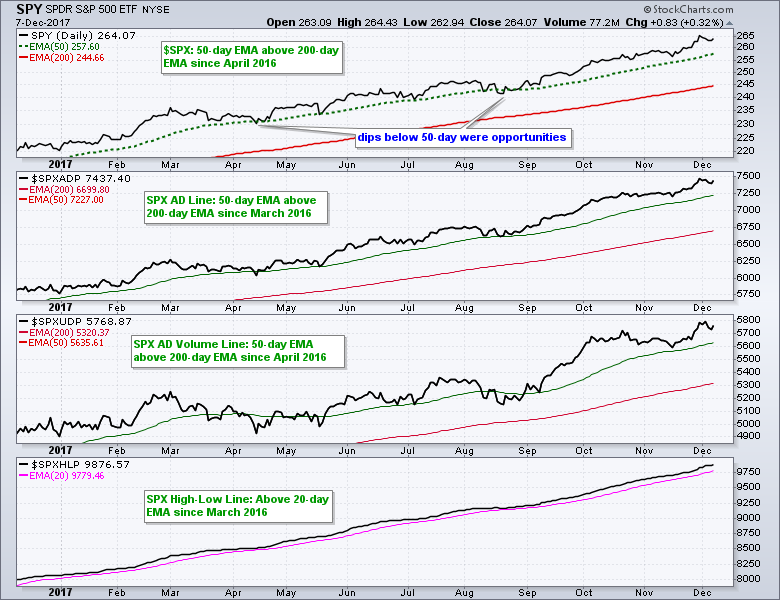
The AD Line and AD Volume Line triggered golden cross signals in March 2016 and April 2016, respectively. These two indicators also recorded new highs over the last two weeks and confirmed the new highs in SPY. The High-Low Line moved above its 20-day EMA in March 2016 and hit a new high this month. There are no divergences present in these indicators and nothing on this chart to suggest an impending top in the stock market. This does not preclude a market correction, as in March-April and August. Notice, however, that the SPY dips below the 50-day EMA provided opportunities to partake in the bigger uptrend. I would stick with this modus operandi as long as the bull market remains in place. In other words, buy-the-dip is the strategy as long as the big trend is up.
Chartists should also note that the AD Lines, AD Volume Lines and High-Low Lines for the S&P Small-Cap 600 and S&P Mid-Cap 400 also recorded new highs over the last two weeks. Small-cap and mid-cap breadth confirms underlying strength in the market as well.
StockCharts Outlook Appearance
I will be joining Greg Schnell for the StockCharts Outlook this Saturday at 11AM ET. We will both be presenting and taking your questions - live. I will cover large-cap, mid-cap and small-cap breadth as well as some select charts from recent commentaries. Note that I covered semiconductors and biotechs on Thursday.

SPY Stalls as QQQ Edges Lower
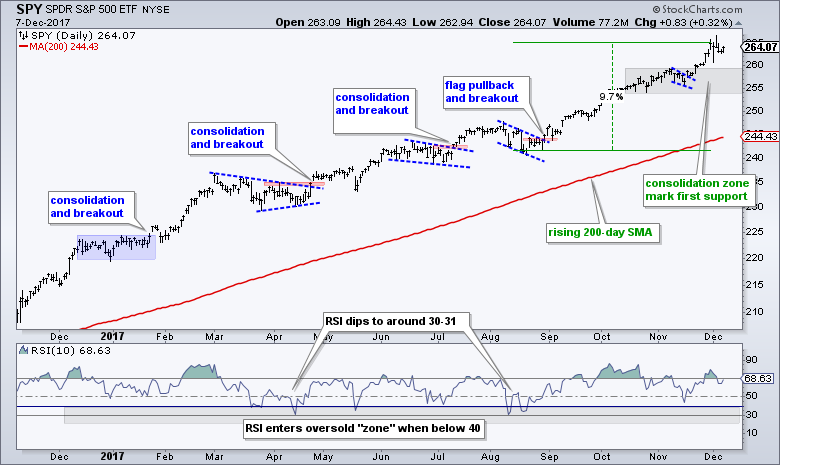
The S&P 500 SPDR (SPY) stalled the last five days by trading within a 2 point range (less than 1%). This is a relatively minor consolidation within short-term and long-term uptrends. With SPY up almost 10% from its August lows and up some 19% year-to-date, it is clearly ripe for a correction of some sort. Corrections can involve a sideways trading range (flat flag), a pullback (falling flag/wedge) or a combination of the two (triangle). Being ripe for a correction and timing a correction are two different things. With the bigger trend up, I am only interested in trying to time the end of a correction, not the beginning. A move into the gray consolidation and an RSI dip into the 30-40 area could be used to the end of such a pullback.
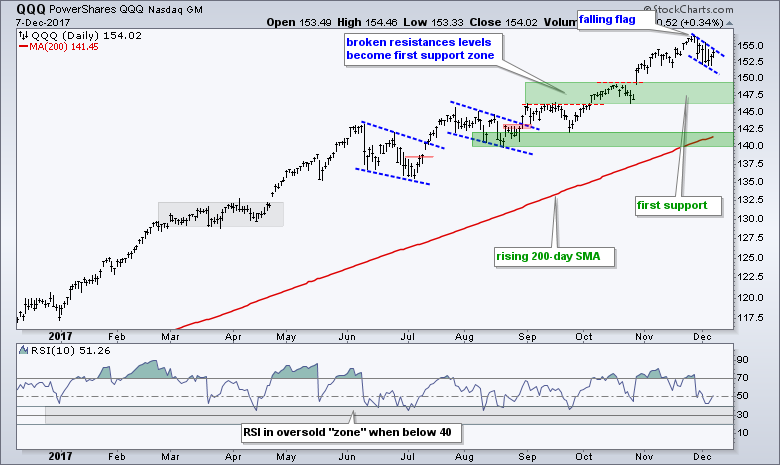
QQQ gave us a small pullback over the last two weeks with a falling flag taking shape. This is a bullish continuation pattern and an upside breakout would signal a continuation of the bigger uptrend. Notice that RSI(10) did not dip below 40 during this pullback so QQQ did not become even mildly oversold. The great rotation out of large-cap techs has been greatly exaggerated!
Watch TLT for Clues on IJR
The S&P SmallCap iShares (IJR) surged to a 52-week high on November 30th and then turned wild with an intraday plunge below 75 and an intraday surge above 78. I would not read too much into this volatility and instead focus on closing prices, as well as the bigger picture. The breakout zone and 38-50% retracement area mark first support and the ETF firmed with a small gain on Thursday. This is the first area to expect a bounce and trend continuation.
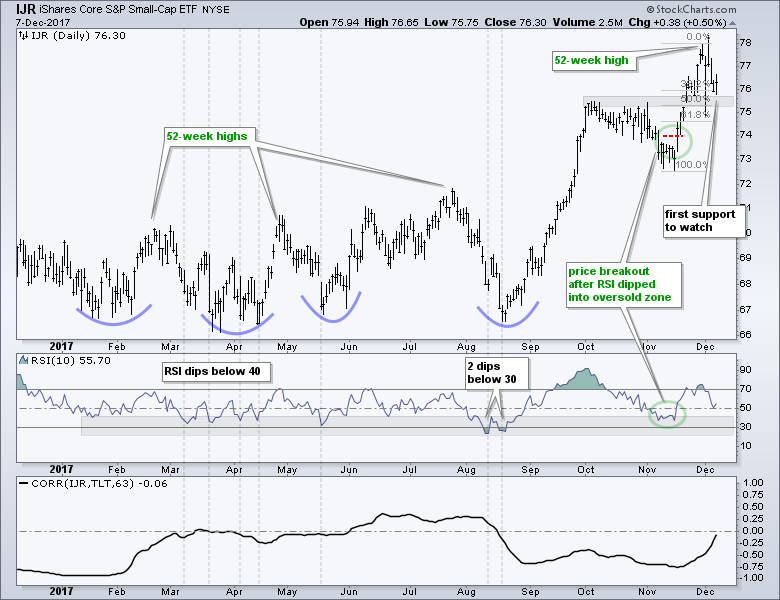 The lower indicator window shows the 63-day Correlation Coefficient for IJR and the 20+ YR T-Bond ETF (TLT). These two are negatively correlated for the most part and this means they move in opposite directions. Note that TLT represents the safe haven trade (risk off) and IJR represents the risk trade (risk on). TLT surged from Friday to Wednesday and IJR fell. TLT then fell sharply on Thursday and IJR bounced. Today is the employment report and the reaction from the bond market will likely influence IJR.
Three New Highs and One Stall
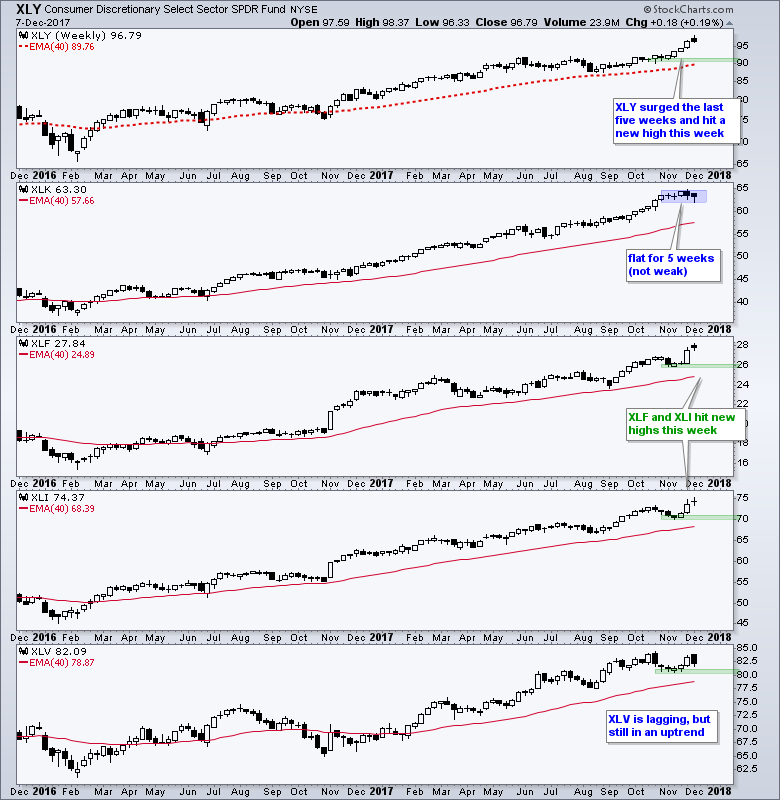
The next chart shows the four offensive sectors and the Health Care SPDR (XLV) . All are above their rising 40-week EMAs. The offensive sectors are represented by the Consumer Discretionary SPDR (XLY), Technology SPDR (XLK), Financials SPDR (XLF) and Industrials SPDR (XLI). XLY, XLF and XLI hit new highs this week so three of the four are still strong, very strong. XLK stalled the last five weeks, but hit a new high in late November and remains in an uptrend. Note that stalling is not the same as weakness. It is just a rest within an uptrend at this stage. Chartists waiting for a pullback should take a look at tech-related stocks and ETFs because many of these pulled back the last two weeks. The Health Care SPDR (XLV) is the weakest of the five because it did not hit a new high. Nevertheless, XLV remains in an uptrend and above first support.
XLE Stalls, but Holds its Breakout
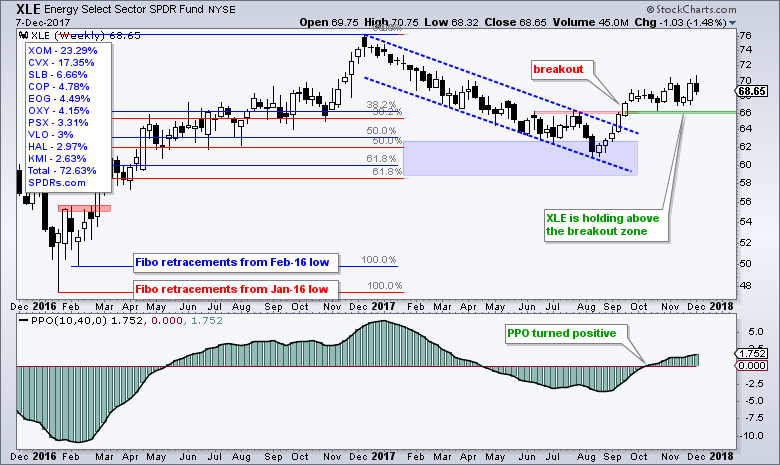
The going has gotten tough for the Energy SPDR (XLE) since the breakout, but the breakout is holding and the chart remains bullish. The weekly chart below shows the falling channel correction that retraced 50-62% of the prior decline and the breakout in September. Also notice that the PPO(10,40,0) turned positive in early October. Even though XLE has stalled the last ten weeks, I will keep a bullish bias as long as the breakout holds (66 area).
Getting Perspective on XME
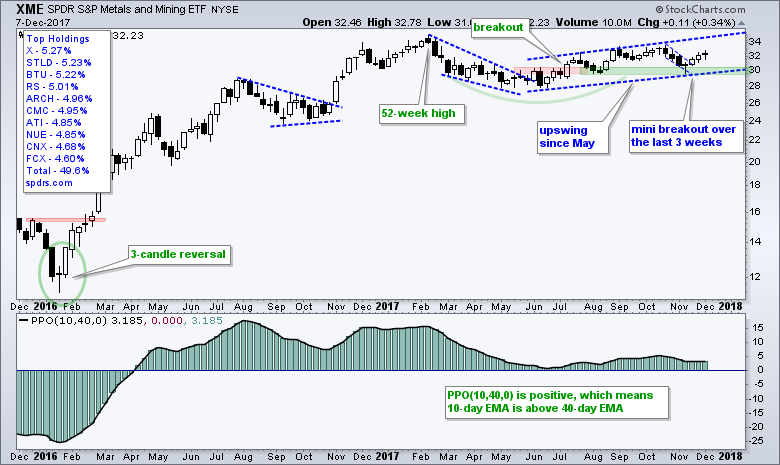
The Metals & Mining SPDR (XME) is one of the 30 or so industry group ETFs that I follow closely and it appears regularly in the Art's Charts ChartList. I normally prefer daily charts that extend 9 to 12 months, but it was difficult to get a clear picture with the daily bar chart for XME. It is at this time that chartists should consider taking a step back and looking at the weekly chart, which is shown below.
Overall, I think XME is in a long-term uptrend because the PPO(10,40,0) remains positive and there is still an upward drift since September 2016 (triangle on chart). Price action has been quite choppy this year with a falling wedge into May, a breakout in July and a rising channel the last five months. I think this rising channel is the main trend that we need to watch. Within the channel, and most recently, I see a 4-week pullback into November and a mini breakout. This chart looks bullish on the six month (long-term) and multi-week (short-term) timeframes. XME led in 2016, lagged in 2017 and 2018 is right around the corner.
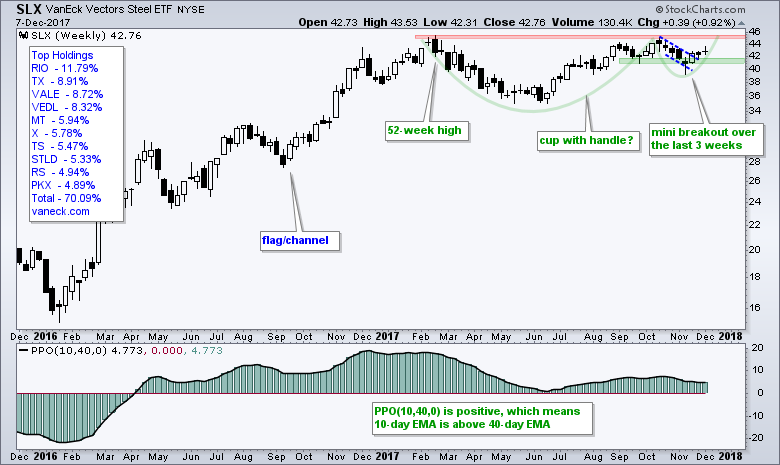
Steel ETF Forms Big Continuation Pattern
The Steel ETF (SLX) is another one that frustrated me on the daily chart so I turned to the weekly chart for some perspective. Overall, SLX surged almost 200% from January 2016 to February 2017 and then formed a cup-with-handle. The blue dashed lines mark the October-November decline and SLX broke out over the last three weeks. This breakout puts in the handle low and argues for a challenge of rim resistance. A breakout here would signal a continuation of the long-term uptrend.
IEF and TLT Remain Divergent
In the spirit of Trading Places and the orange juice report .... and now for the Employment Report ... The 7-10 YR T-Bond ETF (IEF) and the 20+ YR T-Bond ETF (TLT) remain divergent and today's employment report could put them back on the same patch. Note that I am using unadjusted prices by placing an underscore in front of the symbol. IEF has been range bound since late October with a triangle taking shape just above support. TLT, in contrast, advanced the last six weeks with a rising wedge. What would it take to put these two back on the same page? A triangle breakout in IEF would be bullish for Treasury bonds, while a wedge support break in TLT would be bearish.
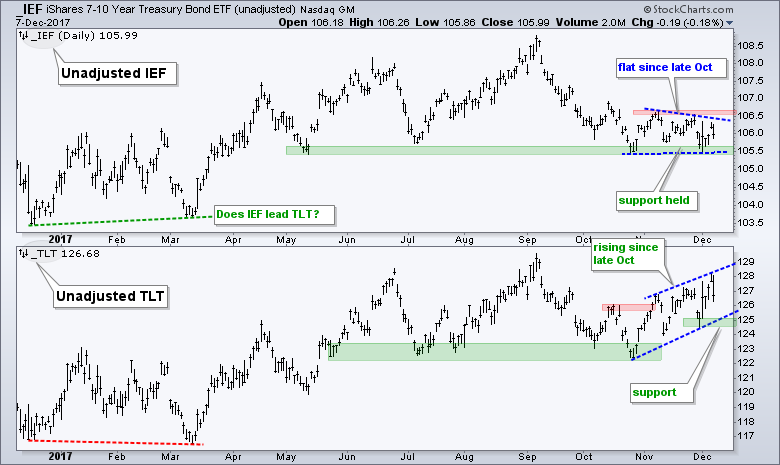
Looking back at the December-March period, I noticed that IEF formed a higher low and TLT formed a lower low. Thus, a little relative strength in IEF foreshadowed extended strength in Treasury bonds from March to early September. IEF is currently lagging TLT because it remains well below its September high. Perhaps relative weakness in IEF is foreshadowing a period of extended weakness for Treasury bonds. As the ultimate safe haven, extended weakness in Treasuries would be bullish for riskier assets, like stocks.
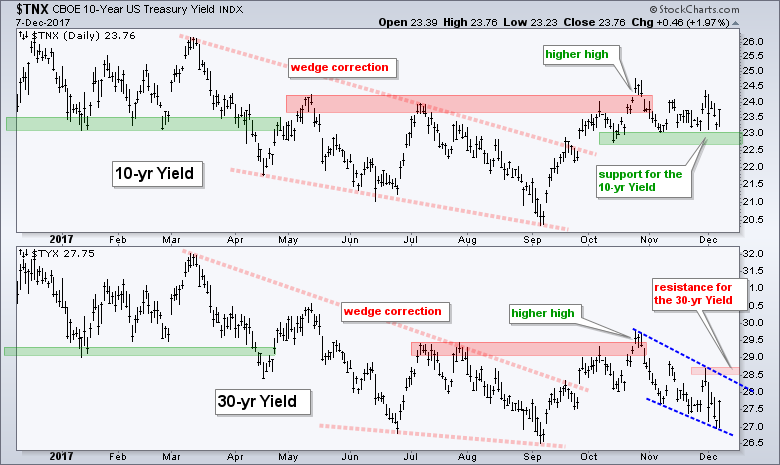
The next chart shows the 10-yr T-Yield ($TNX) with support in the 22.7-23 area (2.27% to 2.3%) and a break here would be bearish for yields (bullish for bonds). The 30-yr T-Yield ($TYX) has resistance 28.7 and a breakout here could be bullish for yields (bearish for bonds).
Gold Breaks as Dollar Turns Up
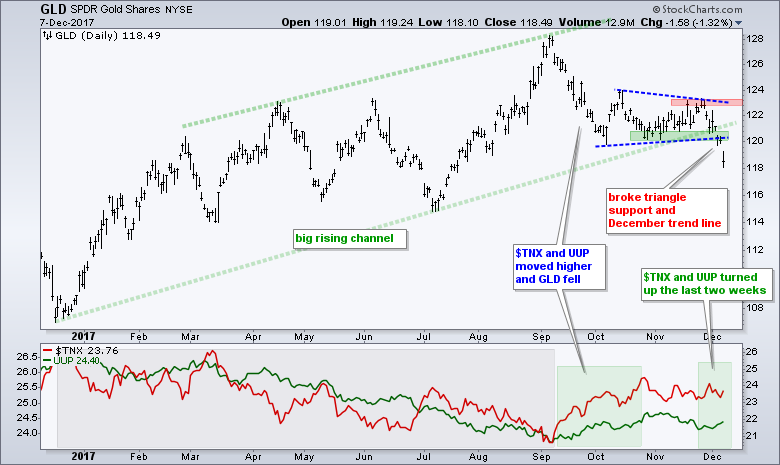
The Gold SPDR (GLD) broke down with a sharp decline this week. Notice that GLD fell sharply in September and then consolidated with a triangle just above the channel trend line. This week's decline broke the triangle and the channel. I will leave resistance in the 123 area for now. The indicator window shows the 10-yr T-Yield ($TNX) and US Dollar ETF (UUP) turning up the last two weeks. GLD is negatively correlated to both and these small upturns produced an outsized reaction, which shows just how fragile gold has become.
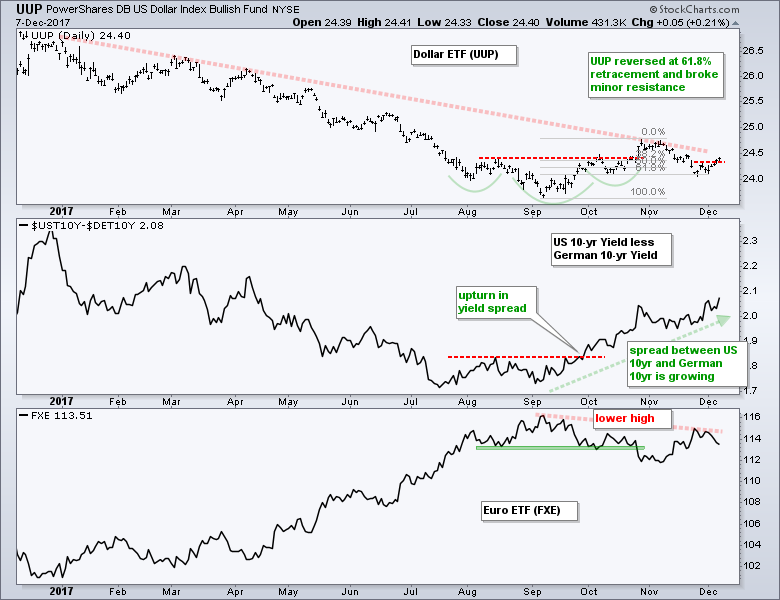
US-German Spread Lifts Dollar
The US Dollar ETF (UUP) was at its moment-of-truth last week and broke out this week. UUP broke out of a small inverse head-and-shoulders pattern and then fell back to the 61.8% retracement in late November. This is a normal retracement after an advance and the area one would expect a pullback to end. It looks like this pullback has ended as UUP broke out with a move above first resistance. The middle window shows the spread between the US 10yr yield and German 10yr Yield widening further. This is bullish for the Dollar and bearish for the Euro. The lower window shows the Euro forming a lower high in late November and turning down the last two weeks.
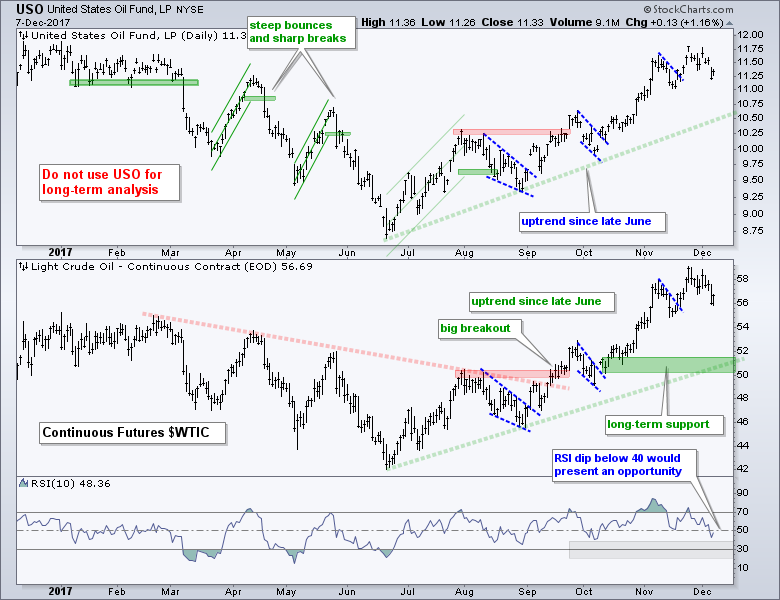
Oil Corrects within Uptrend
Oil fell back over the last two weeks, but remains in an uptrend overall. I am hesitant to react to every little wiggle in oil prices and prefer to simply watch the bigger trend, which has been up since the September breakout. The two week pullback is deemed a small correction within the uptrend and the uptrend is expected to resume at some point.
Discussing Low Correlations and Tech Weakness
The next two links highlight videos from CNBC with analysts that use quantitative methods. In particular, they put recent events into perspective by comparing them to past events. Ms. XU compares the low sector correlations in 2017 to the low sector correlations in 2000 - and describes the difference between then and now. Mr. Hickey looks back at past periods of Nasdaq weakness and shows that these tend to be short lived.
Mandy Xu of Credit Suisse discusses sector correlations and volatility in the equity market with Brian Sullivan.
Tech underperformance is just a 'temporary speed bump,' says Bespoke's Paul Hickey.
Notes from Art's Charts ChartList
- The following bullet points are notes related to the charts in the Art's Charts ChartList, which was updated on 8-Dec (here).
- The Cloud Computing ETF (SKYY) pulled back with a falling flag, which is a short-term bullish continuation pattern.
- The Cyber Security ETF (HACK) retraced 50-61% of its late November surge and then bounced on Thursday.
- The Internet ETF (FDN) became oversold as RSI(10) dipped below 40 and then broke the flag line with a surge the last two days.
- The Networking iShares (IGN) surged to a new high on 30-Nov, fell back to the breakout zone with a 50% retracement and bounced on Thursday.
- The Semiconductor iShares (SOXX) became oversold as RSI(10) dipped below 30 and the ETF retraced 38% of its prior advance.
- The Software iShares (IGV) formed a falling flag as RSI(10) touched 30 this week.
- The Mortgage REIT ETF (REM) broke out on 17-Nov, dipped last week and turned back up this week.
- The REIT iShares (IYR) retraced 50-62% of its prior surge and RSI moved into the oversold zone (<40).
- The Airline ETF (JETS) remains in a steep ascent with a Raff Regression Channel defining the uptrend since mid November.
- The Solar Energy ETF (TAN) retraced 50-61% of its Sep-Nov surge and RSI dipped below 40 (oversold zone).
- The Biotech iShares (IBB) and Biotech SPDR (XBI) are in long-term uptrends and testing the mid November lows after a pullback.
- The Medical Devices ETF (IHI) pulled back and RSI(10) dipped below 40.
- The Oil & Gas Equip & Services SPDR (XES) is at a moment-of-truth as it tests support in the 15 area (rising wedge vs inverse H&S).
- The Copper Miners ETF (COPX) is the most oversold since early May and near the 50% retracement.
- The oversold bounce in the Telecom iShares (IYZ) ended as the ETF formed another lower high and turned down with a sharp decline this week.
******************************************************
ETF Master ChartPack - 300+ ETFs organized in a Master ChartList and in individual groups.
Follow me on Twitter @arthurhill - Keep up with my 140 character commentaries.
****************************************
Thanks for tuning in and have a good day!
--Arthur Hill CMT
Plan your Trade and Trade your Plan
*****************************************
