- Small-cap ETF Triggers a Signal.
- Regional Bank SPDR Gaps within a Triangle.
- Earnings Season Starts Soon.
- Five Automakers Hit New Highs - Who's Next?
- Three Healthcare Stocks Setting Up Bullish.
Small-cap ETF Triggers a Signal
The S&P SmallCap iShares (IJR) hit a 52-week closing high on Monday and triggered a bullish signal. Note that I highlighted IJR last week as it consolidated near the upper end of a triangle pattern.
With three straight up days, IJR broke out of the triangle and the flat consolidation. This breakout signals a continuation of the bigger uptrend and targets a move to the low 80s. We can add the height of the triangle (~4) to the breakout zone (~78) for a rough target.
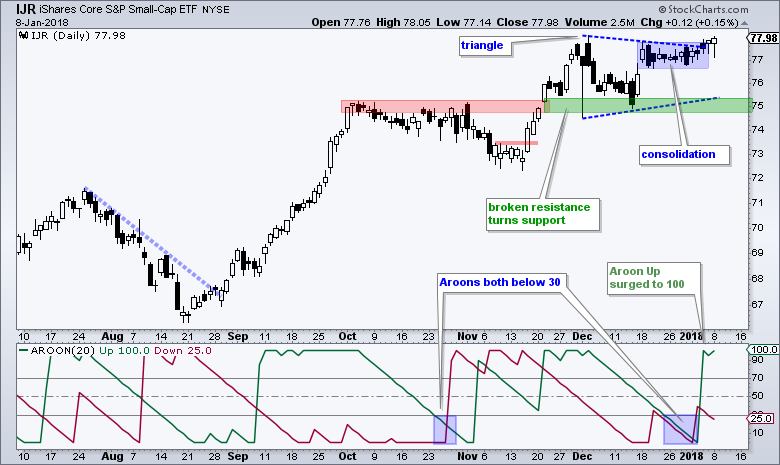
I also showed both Aroon Oscillators below 30 last week and noted that I will be watching for the first one to break above 50. A consolidation is often present on the price chart when both Aroons are below 30. Aroon Up (green) broke above 50 last week and even hit 100, which points to a consolidation breakout.
Regional Bank SPDR Gaps within a Triangle
The Regional Bank SPDR (KRE) chart looks similar to the IJR chart above and Thursday's gap could foreshadow a breakout. As with IJR, KRE sports a triangle consolidation after a 52-week high. The 52-week high means the long-term trend is up and triangles are typically continuation patterns. Thus, this triangle is viewed as a bullish continuation pattern. A breakout at 60.5 would end the consolidation period and signal a continuation of the bigger uptrend. Separately, note that OZKR, BBT, HBAN, RF and STI hit new highs this year.

A peek inside the triangle reveals a mini-breakout with Thursday's gap. I rarely look at intraday charts because I am allergic to the noise, but I am using one today for a clearer picture of the gap and mini breakout. Note that technical analysis is fractal and this means chart patterns and setups can be applied to any timeframe. The chart below shows a classic sequence: surge, wedge correction, 61.8% retracement and gap-breakout on January 4th.

Earnings Season Starts Soon
Earnings season is upon us and this means most companies will be reporting in the coming weeks. I am going to highlight some individual stock charts and put the earnings date on the chart - just so you know. I am not that interested in the earnings reports themselves, but I do try to avoid stocks that are reporting within two weeks of taking a trade. For what it's worth, I started using IBD.com to find out when a stock reports earnings. Simply get a quote on a symbol and scroll down toward the bottom to find the earnings date. Here is a link for Eli Lilly.
Five Automakers Hit New Highs - Who's Next?
Ford (F), Honda (HMC), Daimler (DDAIF), Toyota (TM), Volkswagen (VLKAY) and the Global Auto ETF (CARZ) hit new highs this year and all are up 4% or more year-to-date. GM is the only one of the group that has yet to hit a new high, but it is the leading gainer with a 7.88% advance year-to-date.

GM looks like the next in line to hit a new high. The chart shows GM with a big breakout, a monster advance and a 52-week high in the third quarter of 2017. The stock corrected after this surge with a falling wedge back to the 41 area. It looks like this correction ended as GM broke the late December high and wedge line with a surge the last five days.

Before leaving this chart, notice that the RSI dip below 30 nailed the mid December low. This is also when GM allegedly broke the early November low (support). The chart certainly looked short-term ugly at this point, but the so-called support break and RSI dipped below 30 nailed the low. Mean-reversion trades do not always work this well, but there is a clear lesson to be learned here: short-term oversold conditions in long-term uptrends are opportunities, not threats!
Three Healthcare Stocks Setting Up Bullish
The Health Care SPDR (XLV) also hit a new high last Friday, but fell back because of weakness in some big biotechs on Monday (REGN, BIIB, ALXN). The Biotech iShares (IBB) and Biotech SPDR (XBI) were down over 1%. I am not negative on healthcare or biotech in general because I think their respective ETFs are in long-term uptrends. This is why I am still looking for individual stock setups within the sector and industry group.
The first chart shows Eli Lilly (LLY) with a big triangle breakout and 52-week high (long-term uptrend). The stock turned choppy after this breakout, but the last two pullbacks retraced around 61.8% of the prior advance. This is akin to three steps forward and one step backward. Thus, I view these as normal pullbacks within a bigger uptrend. LLY ended the most recent pullback with a breakout on Friday.

The next chart shows AMGN surging to a 52-week high in September, correcting with a 50 to 61.8 percent retracement and surging off the 200-day EMA. The stock consolidated with a triangle after this surge and broke out of the triangle last week. The breakout is holding and I expect AMGN to continue its uptrend.

The third stock is Gilead (GILD), which is clearly the most volatile and the riskiest of the three. The stock surged some 35% from June to early September and then fell around 18% with the decline back to the low 70s. This decline, however, still only retraced around two thirds of the prior advance.

We cannot draw a nice channel or wedge to define this decline from September to November. It is also a challgenge to mark a resistance level, but there is something to watch short-term. I see a surge on Tuesday-Wednesday and a stall the last three days. This flag pattern is shown on the left side of the chart. A breakout at 75 would end this short-term stall and open the door to further gains.
ETF Master ChartPack - 300+ ETFs organized in a Master ChartList and in individual groups.
Follow me on Twitter @arthurhill - Keep up with my 140 character commentaries.
Thanks for tuning in and have a good day!
--Arthur Hill CMT
Plan your Trade and Trade your Plan
