- Another Bearish Breadth Thrust.
- High-Low Percent Indicators Remain Bullish.
- %Above 200-day Indicators Dip below 50%.
- Index Table Remains Bullish.
- Sector Breadth Highlights.
- Bottom Line: Still a Bull Market.

Breadth Overview ...
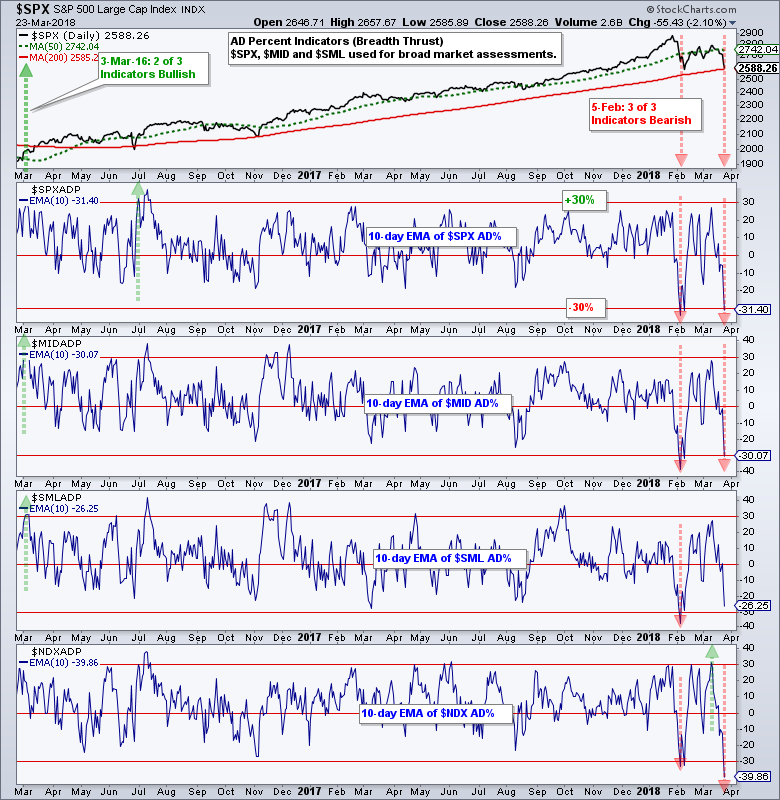
The following breadth assessment is based on three breadth indicators. First, the 10-day EMA of AD Percent is used to measure bearish and bullish breadth thrusts. This is by far the most sensitive of the three. This means it often signals before the other two indicators and can be prone to whipsaws. Second, High-Low Percent is used to measure leadership and strong uptrends. Third, the percentage of stocks above the 200-day EMA is used to measure stocks in long-term uptrends. The name of each indicator is linked to a detailed article explaining its use.
The following charts show these breadth indicators for the S&P 500, S&P Mid-Cap 400, S&P Small-Cap 600 and Nasdaq 100. I added the Nasdaq 100 because of its leadership overall, but do not include it in my broad market assessment table because over 80% of stocks in the Nasdaq 100 are also in the S&P 500. This makes the Nasdaq 100 redundant for a broad market assessment.
Another Bearish Breadth Thrust...
The 10-day EMA of AD Percent plunged below -30% for the S&P 500, S&P Mid-Cap 400 and Nasdaq 100. This is the second time in as many months that we see a bearish breadth thrust in the S&P 500 and S&P Mid-Cap 400. The S&P Small-Cap 600 did not trigger a second bearish breadth thrust as small-caps held up better than large-caps and mid-caps.
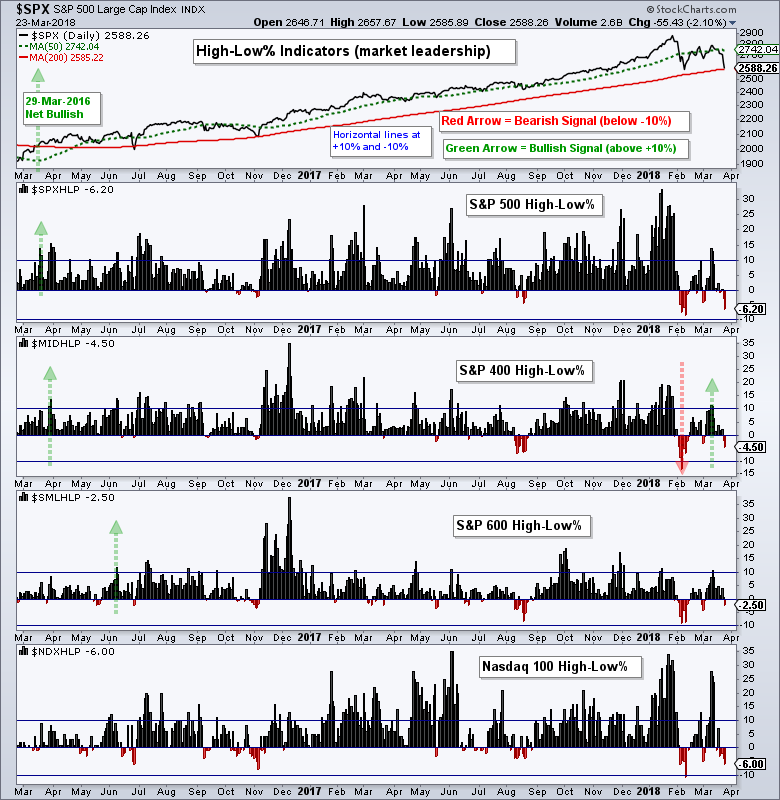
High-Low Percent Indicators Remain Bullish
The High-Low Percent indicators turned negative as we saw an expansion of new lows, but not negative enough to trigger signals, which requires a move below -10%. Notice that High-Low Percent was the most negative for the S&P 500 (-6.2%) and the S&P Mid-Cap 400 (-4.5%). Again, small-caps held up better as High-Low Percent only reached -2.5%.
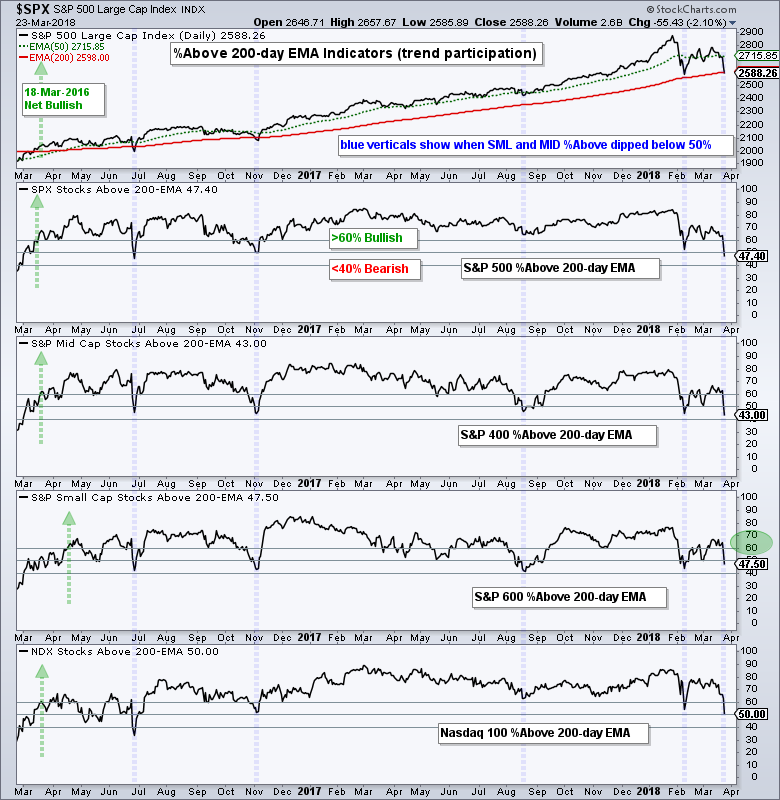
%Above 200-day Indicators Dip below 50%
The S&P 500 %Above 200-day EMA (!GT200SPX) dipped below 50% and to its lowest level since June 2016 (Brexit). Note that I do not use the 50% line for signals because there would be too many whipsaws. A move below 40% is needed to show enough "critical mass" to warrant a bearish signal. Thus, these indicators are bending, but they have yet to break. Keep in mind that this is a long-term trend following type indicator.
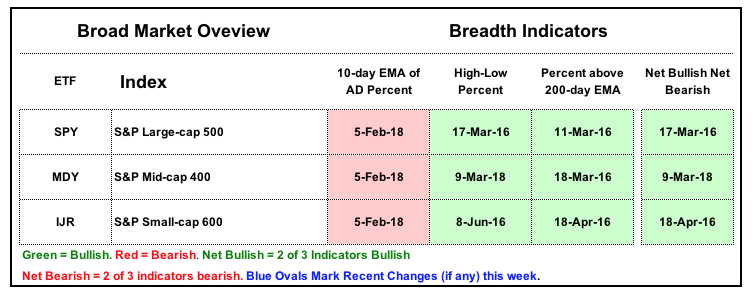
Index Table Remains Bullish
Surprisingly, there is no change in the major index breadth table. The net bullish signals from March 2016 remain in play until proven otherwise. This means we still need to see some bearish signals from High-Low Percent and %Above 200-day EMA before this table turns bearish.
Sector Breadth Highlights
Note that there is a list with chart links for each sector at the end of this commentary.
- The Consumer Discretionary SPDR (XLY) triggered its second bearish breadth thrust in as many weeks. High-Low Percent finished at -9.64% and %Above 200-day EMA ended at 42.17%. These two are not far from a bearish signal for the most economically sensitive sector.
- The Technology SPDR (XLK) triggered its first bearish breadth thrust since January 2016.
- The Financials SPDR (XLF) and Health Care SPDR (XLV) triggered bearish breadth thrusts. This leaves the Industrials SPDR (XLI) as the only sector without a bearish breadth thrust. Note that XLI triggered a bearish breadth thrust on February 5th, but countered this signal with a bullish thrust on February 26th.
- The Materials SPDR (XLB) had a bad week as the %Above 200-day EMA moving below 40% and finished at 36%. The breadth indicators are now net bearish for this sector (two of three with bearish signals).
- The Consumer Staples SPDR (XLP) also had a bad week with two bearish signals. XLP also hit a 52-week low this week and all three breadth indicators are net bearish.
The table below sums up the sector signals. Eight of nine sectors have active bearish breadth thrust signals. Three of nine have active bearish signals for High-Low Percent and four of the nine have active bearish signals for %Above 200-day EMA.
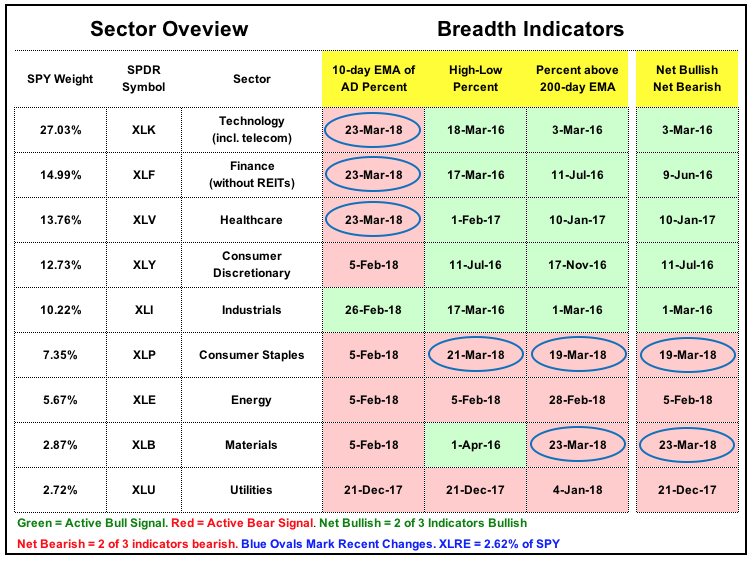
There is certainly a lot of red, but the top of the table, which represents the five largest sectors, is still mostly green. The bearish breadth thrust is a warning shot, but the longer-term trend indicators have yet to trigger.
Bottom Line: Still a Bull Market
The bull market signal from March 2016 has yet to be reversed. More selling pressure early next week, however, would likely be enough to tilt the balance. The S&P 500 closed right at its rising 200-day SMA so I would not be surprised to see an oversold bounce that keeps this bear market signal on hold.
Keep in mind that this breadth table is designed to identify bull and bear market environments. It has been net bullish since March 2016 and stayed bullish throughout 2017. This was a great run and I do not know when it will end. It ends when it ends, and not a moment sooner. This is the how systematic approaches work. Take the signal and avoid the guesswork, which is hard to do sometimes.
Even though the last signals caught a sustained uptrend since March 2016, this is a trend following system that will not pick market bottoms or market tops. Signals will trigger when the evidence turns. Also note that this system, like any other system, is not immune to whipsaws. In particular, there were whipsaws in the latter part of 2011 .
Plan Your Trade and Trade Your Plan.
- Arthur Hill, CMT
Senior Technical Analyst, StockCharts.com
Book: Define the Trend and Trade the Trend
Twitter: Follow @ArthurHill
