- The Strange Correlation between Gold and Silver.
- Gold Looks Poised to Continue Trend.
- Silver ETF Breaks Wedge Line.
- Copper the Chopper Bounces.
 Correlation between Gold and Silver...
Gold and silver have not been on the same page lately, but there is still a strong positive correlation between the two. The chart below shows Gold Continuation Futures ($GOLD) up over 7% in the past year and the Silver Continuous Futures ($SILVER) down over 7% during this same time period.
Despite these seemingly divergent moves, the indicator window shows the Correlation Coefficient ($GOLD,$SILVER) above .50 for most of the past year. This positive correlation means both tend to move in the same direction. How can the correlation coefficient be positive with such a large performance difference?
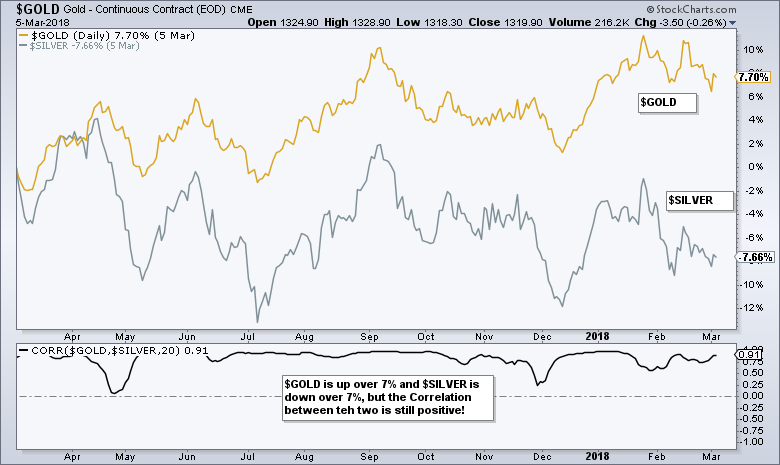 The Correlation Coefficient compares price changes in a binary fashion. The Correlation Coefficient is +1 when both rise or both fall, regardless of the magnitude of the move. Thus, gold could surge 2% and silver could rise just .02% and the correlation would still be +1. Similarly, the correlation would be +1 were gold to fall just .03% and silver to lose a whopping 3%. A positive correlation coefficient means we can expect silver to rise/fall when gold rises/falls, but not by the same magnitude.
Gold Looks Poised to Continue Trend
There is a clear trend present in bullion and today we got the first signs that a corrective pattern is ending.
Note that I covered the bullish patterns in GLD and SLV in Friday's commentary and this is simply an update to the charts. GLD broke out of a wedge in December and hit a 52-week high in late January. Also note that the 50-day EMA is above the 200-day EMA (not shown). The long-term trend for gold is clearly up.
Medium-term, GLD fell back with a falling flag or channel over the last six weeks (fat flag). Given the long-term uptrend and clear bullish bias on this chart, I would treat this as a correction within the uptrend.
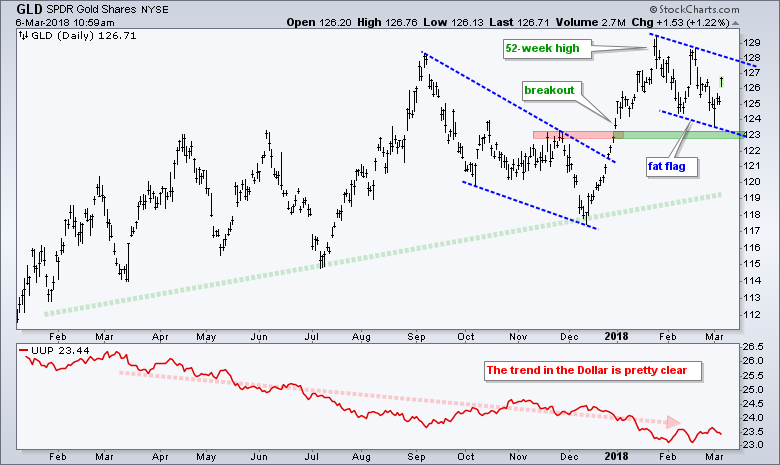
GLD managed to firm around 125 last week and then surged above 126 today. Even though we have yet to see a channel breakout, this surge is the first sign that the correction is ending and the bigger uptrend is resuming.
The indicator window shows the US Dollar ETF (UUP) in a long-term downtrend. I am not going to speculate on the short-term wiggles, but I will note that the long-term downtrend is net positive for gold.
Silver ETF Breaks Wedge Line
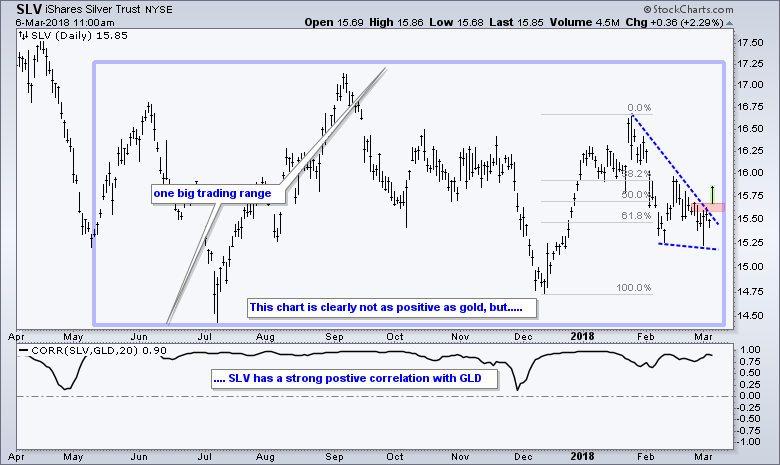
The next chart shows SLV in a large trading range since May 2017. It is hard to make the case for a long-term directional bias, but silver does have a strong positive correlation to gold and strength in gold bodes well for silver. We just don't know the magnitude!
On the price chart, SLV surged from mid December to late January and then retraced around 70% of this surge with a decline to the 15.25 area. Notice how SLV bounced off this level twice and broke above the wedge line with a big move today.
Copper the Chopper Bounces
The short-term and medium-term moves are choppy for the Copper ETN (JJC), but the overall trend is clearly up and the ETF is bouncing near support. Note that JJC recorded 52-week highs in September, October and January. This alone is enough to justify a long-term uptrend.
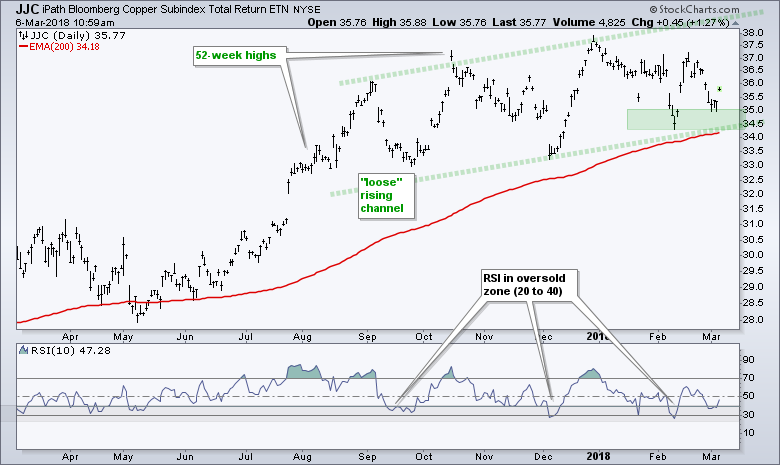
The chart also shows rising troughs over the last six months. The shaded green lines define a "loose" rising channel and the current uptrend. The rising 200-day EMA, lower trend line and February-March lows combine to mark support in the 34.5-35 area. With the bounce today, I would expect copper to continue its uptrend and hit new highs in the coming weeks or months.
Plan Your Trade and Trade Your Plan.
- Arthur Hill, CMT
Senior Technical Analyst, StockCharts.com
Book: Define the Trend and Trade the Trend
Twitter: Follow @ArthurHill
