- Market Overview.
- A Bull Market for the S&P 500.
- IJR Leads IWM and the Rest.
- S&P 500 Leads New High List.
- Tech, Healthcare and Industrials Lead New High List.
- XLC Starts Trading.
- XLU and IYR Extend Breakouts.
- Cloud Computing ETF Forms Bull Flag.
- Regional Bank SPDR Turns Up.
- Aerospace & Defense ETF Breaks Triangle and Flag.
- A Small Divergence for XBI.
- Bond ETFs Hit Moment-of-truth.
 Market Overview
August is shaping up to be a rather weird month for the stock market. The S&P 500 SPDR (SPY) and 20+ YR T-Bond ETF (TLT) are both up around 1.3% month-to-date. Thus, we are seeing money move into risky assets (stocks) and safe haven assets (bonds). The US Dollar ETF (UUP) is up around 1.84% this month and in a strong uptrend. This is perhaps weighing on large-caps because the S&P SmallCap iShares (IJR) is up 2.36% in August and leading with a fresh 52-week high.
Seven of the nine sector SPDRs are higher this month, but the defensive side of the market is showing some leadership. Note that the healthcare, consumer staples, utility and REIT sectors are up between 2.43% and 3.28%. Among the offensive sectors, the Technology SPDR (XLK) is keeping pace with a 3.14% gain, but the Industrials SPDR (XLI) is down month-to-date and the Financials SPDR (XLF) is lagging.
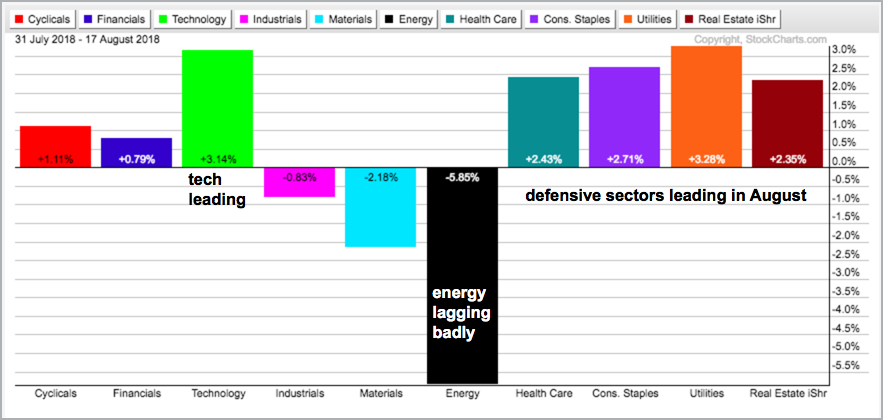
Even though September and October are around the corner, I am not that concerned with three weeks of relative strength in the defensive sectors because the majority of the market remains bullish. As detailed later in this commentary, the industrials, healthcare and technology sectors are producing the most new highs and these three account for around 50% of the S&P 500. In addition, the Retail SPDR (XRT) hit a new high this week and the Regional Bank SPDR (KRE) perked up the last three weeks.
Programming Note: I am on the road and there is no video this week. I will resume the videos next Friday and also update the Arts Charts ChartList next week.
A Bull Market for the S&P 500
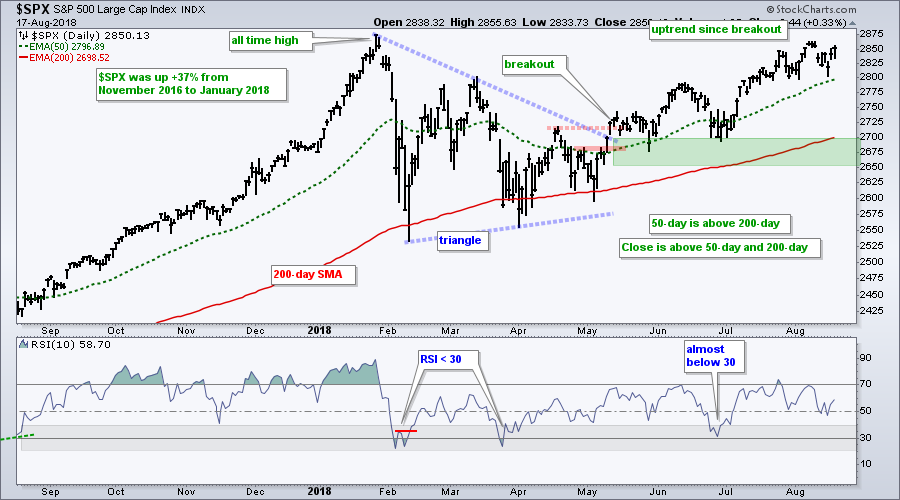
The S&P 500 remains in an uptrend and in bull market mode. After a gap down on August 10th and dip to the 2800 area on August 15th, stocks rebounded with a gap up and surge over the last two days. These gaps, dips and rebounds are short-term noise and did not affect the bigger picture. The index broke out of a big triangle in May to end the three month consolidation and signal a continuation of the prior advance, which was 37%. The rising 50-day EMA is above the rising 200-day EMA and price is above both EMAs. There is nothing negative on this chart and I expect a new high in the coming weeks. Why? Because the trend is up and higher highs are expected in an uptrend.
IJR Leads IWM and the Rest
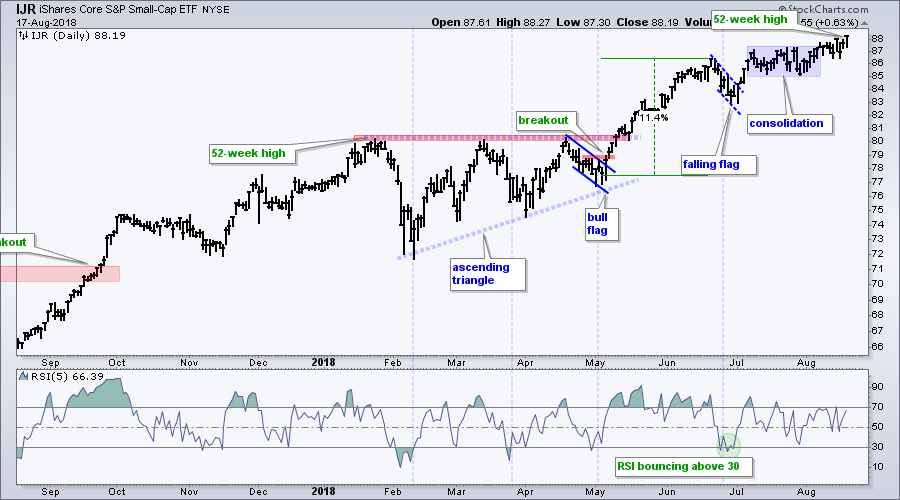
The S&P SmallCap iShares (IJR) is leading the broader market with a fresh 52-week high on Friday. Note that IJR is also leading the Russell 2000 iShares (IWM) because it did not hit a new high last week. As with the S&P 500, IJR is simply working its way higher since the flag breakout in early July. The ETF stalled for a few weeks after this breakout, but renewed the advance with a move from 85 to 88 the last three weeks.
S&P 500 Leads New High List
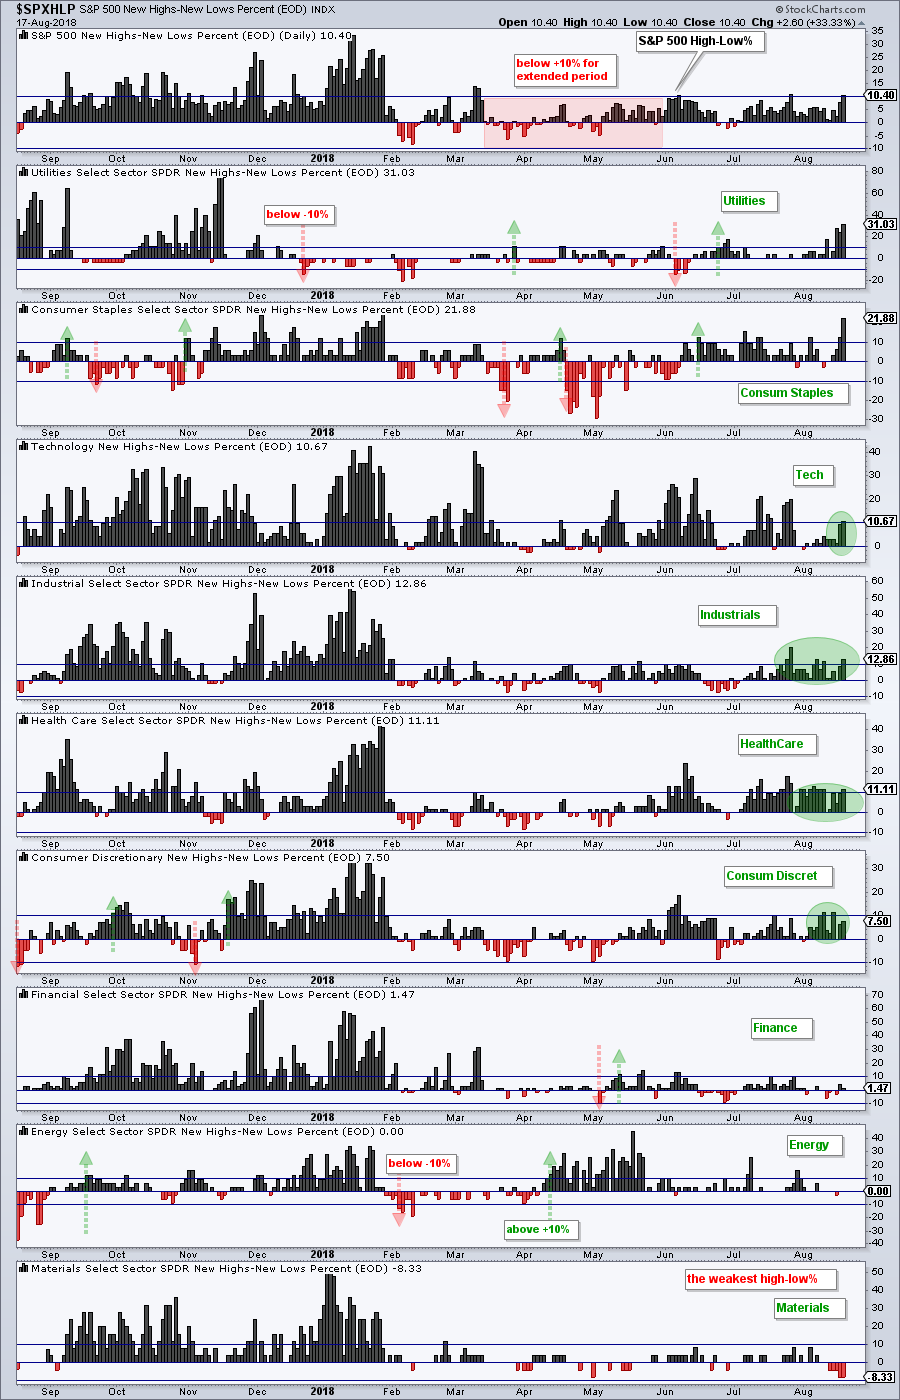
S&P 500 High-Low% ($SPXHLP) moved above +10% this week and this is the third reading above +10% since mid June. Even though Friday's 10.4% reading is below the levels seen in January, new highs are outperforming new lows by a wide margin and this is bullish for the market overall.
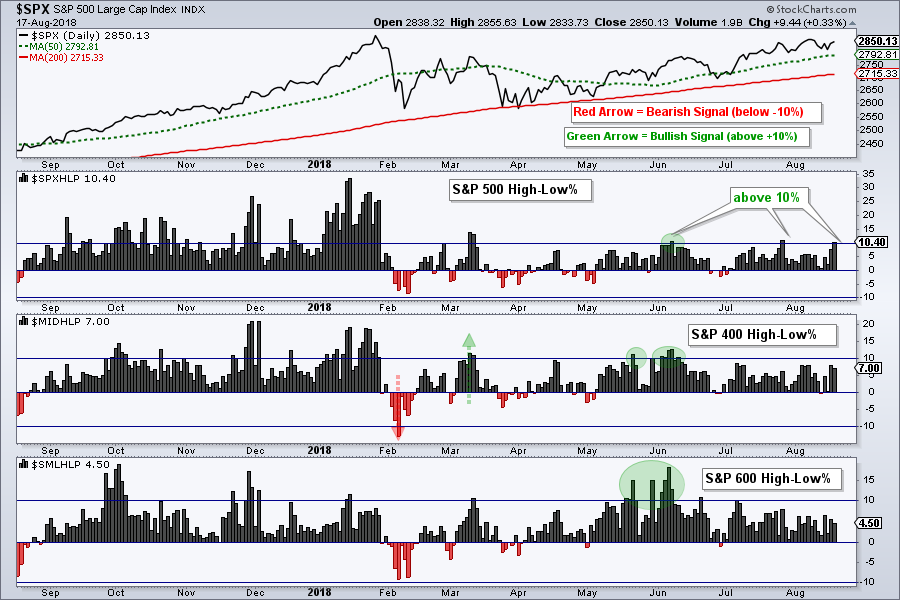
Also notice that High-Low Percent for the S&P 500 is higher than that for the S&P Small-Cap 600 and S&P Mid-Cap 400. S&P 600 High-Low% ($SMLHLP) and S&P 400 High-Low% ($MIDHLP) did not exceed +10% last week. Even though they are lagging and not as strong, there are still more new highs than lows and this is net bullish.
New Highs in Tech, Healthcare and Industrials
Even though utilities and consumer staples have higher High-Low Percent values, I think the technology, industrials and healthcare sectors are the real leaders when it comes to stocks recording new highs. High-Low Percent is the difference between new highs and new lows divided by total issues. Showing net new highs as a percentage of total issues makes this indicator comparable across sectors.
However, some sectors have more stocks than other sectors. Here are the total stocks in the five leading sector SPDRs: Technology (74), Industrials (70), Healthcare (65), Consumer Staples (32) and Utilities (29). Assuming no new lows, a High-Low Percent value of 10% equates to 7 new highs for XLI and 3 new highs for XLU. XLI has 70 stocks and XLU has just 29.
The chart below shows utilities and consumer staples with the highest High-Low Percent values, but they also have fewer stocks than the other three sectors. High-Low Percent for technology, healthcare and industrials is above 10%. Together, these three sectors have 209 stocks and this equates to over 21 new highs (roughly). There are plenty of leading stocks in these big sectors and this bodes well for the bulls.
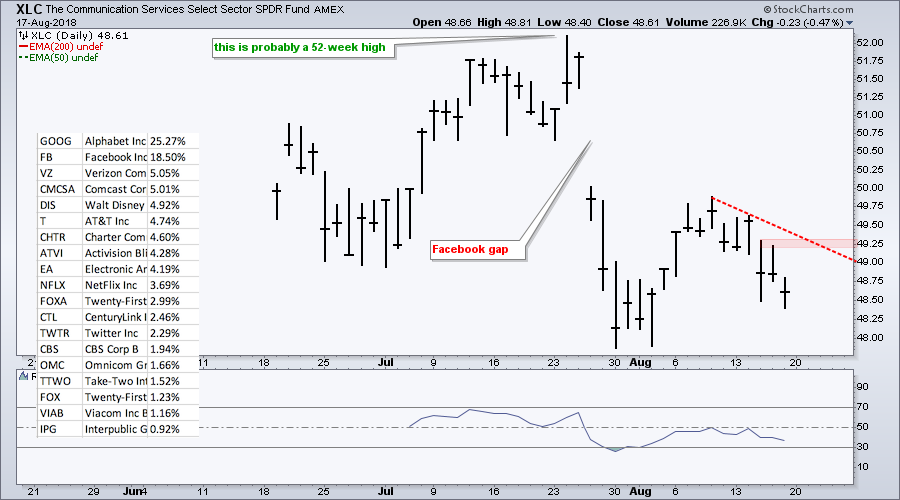
XLC Starts Trading
In case you have not heard, there is a new sector in town: Communication Services (XLC). Current data only goes back to mid June so analysis is a bit tricky. Also note that the stocks in this sectors are still part of their original sectors. For example, GOOG is still part of XLK and DIS is still part of XLY. I am not sure when we will see a clean break. In any case, the chart below shows XLC and some of the top components. It is a rather strange mix!
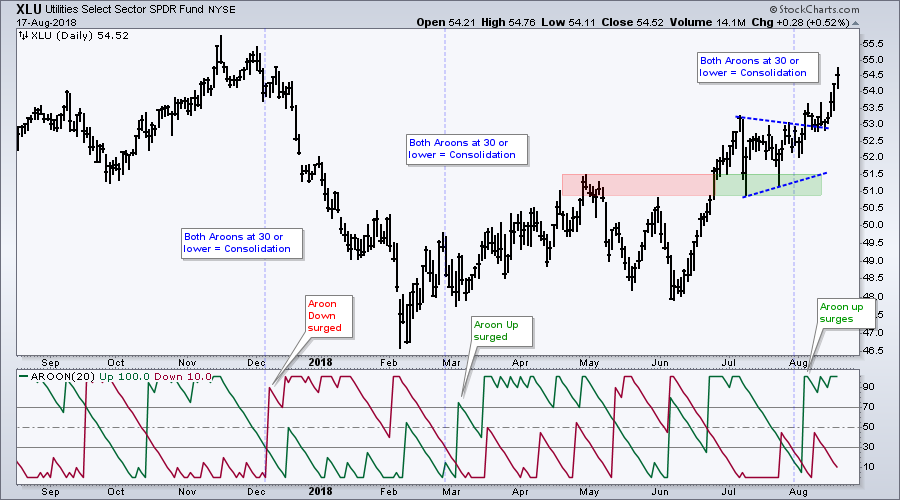
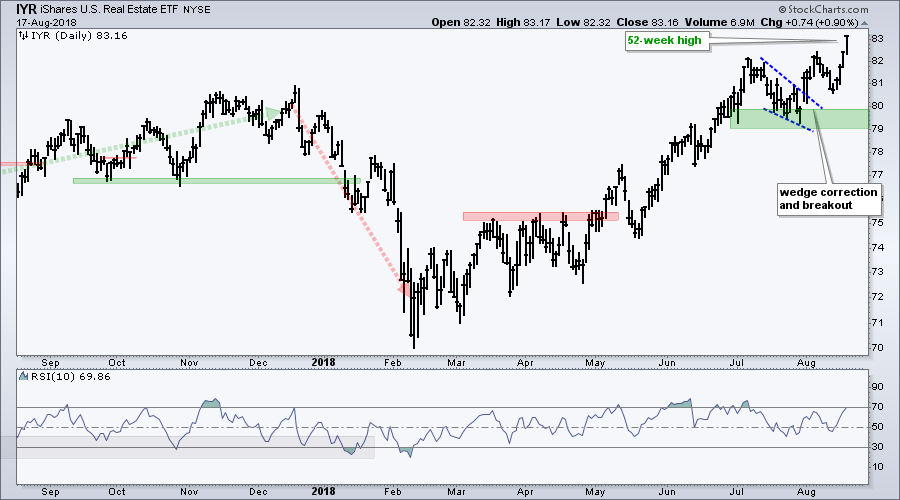
XLU and IYR Extend Breakouts
The Utilities SPDR (XLU) and the REIT iShares (IYR), two interest rate sensitive ETFs, are leading in August. XLU is up 3.28% over the last 13 trading days and IYR surged to a new high. The first chart shows XLU forming a triangle as the Aroon oscillators moved below 30. XLU broke out and Aroon Up surged to 100. The second chart shows IYR breaking out of a wedge correction in late July and surging the last four days.
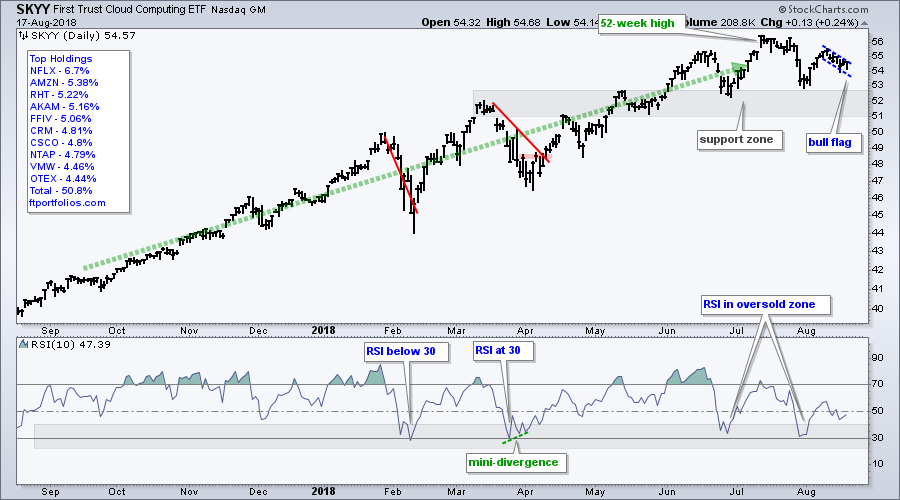
Cloud Computing ETF Forms Bull Flag
The Cloud Computing ETF stalled over the last two months, but the big trend is up and I would still focus more on short-term bullish setups than possible bearish reversal patterns. SKYY got an oversold bounce in late July and early August, and then pulled back with a falling flag. Look for a break above 55 to continue the bounce.
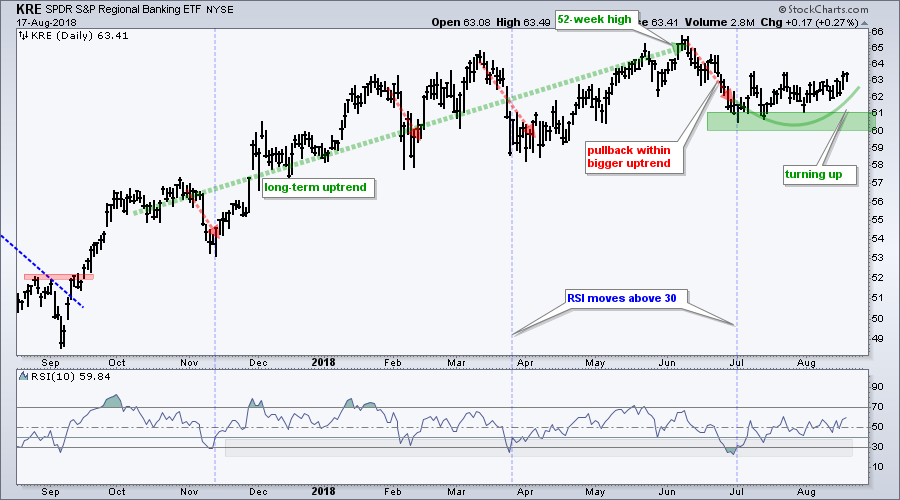
Regional Bank SPDR Turns Up
The Regional Bank SPDR (KRE) could be resuming its uptrend. The overall trend is up with a 52-week high in mid June. KRE pulled back into late June and became short-term oversold as RSI dipped below 30. The bounce from oversold levels has been tentative, but gained a little steam with a nice gain the last four days.
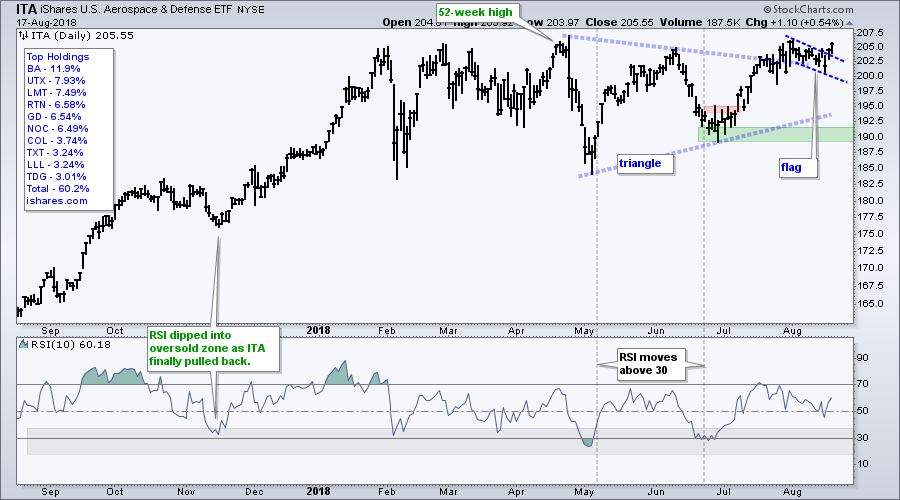
Aerospace & Defense ETF Breaks Flag
The iShares Aerospace & Defense ETF (ITA) is also perking up with a triangle breakout in late July, a falling flag into August and a flag breakout this week.
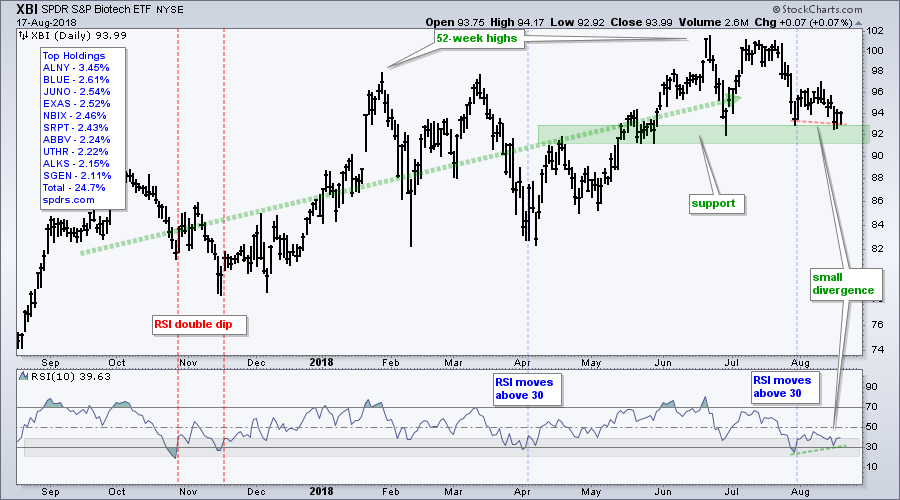
A Small Divergence for XBI
The Biotech SPDR (XBI) could be poised for a bounce as it hits support and RSI forms a small bullish divergence. The big trend is up with the 52-week high in June. The green zone marks support from broken resistance and the June low. XBI bounced off this zone in early August, but fell back below 94. Notice that closing prices formed a lower low and RSI formed a higher low for a bullish divergence. I do not use divergences very often, but this one jibes with the bigger uptrend and could foreshadow a bounce in the ETF.
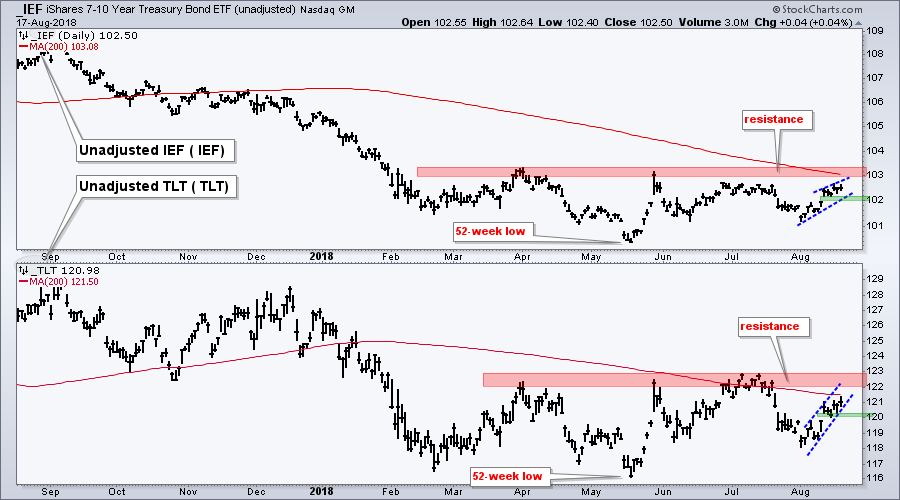
Bond ETFs Hit Moment-of-truth
The 20+ YR T-Bond ETF (TLT) and the 7-10 YR T-Bond ETF (IEF) bounced towards resistance over the last three weeks. Even though both traded flat the last five months, the long-term trends are down and resistance is near. The green zones mark first support to watch for a short-term breakdown that could signal a continuation of the bigger downtrend. Watch 102 for IEF and 120 for TLT.
Questions, Comments or Feedback?
I cannot promise to response to all correspondence, but I will read it and take into under consideration. I greatly appreciate all feedback because it helps me improve the commentary and provides ideas for the future. Sorry, I do not take symbol requests.

Plan Your Trade and Trade Your Plan.
- Arthur Hill, CMT
Senior Technical Analyst, StockCharts.com
Book: Define the Trend and Trade the Trend
Twitter: Follow @ArthurHill
