- QQQ Holds Up as Small-caps Fall.
- Finance Sector Fails to Hold Breakout.
- Defining the Upswing in XLF.
- Regional Banks and Brokers Break.
- Home Construction Breaks Triangle Line.
 ...QQQ Holds Up as Small-caps Fall
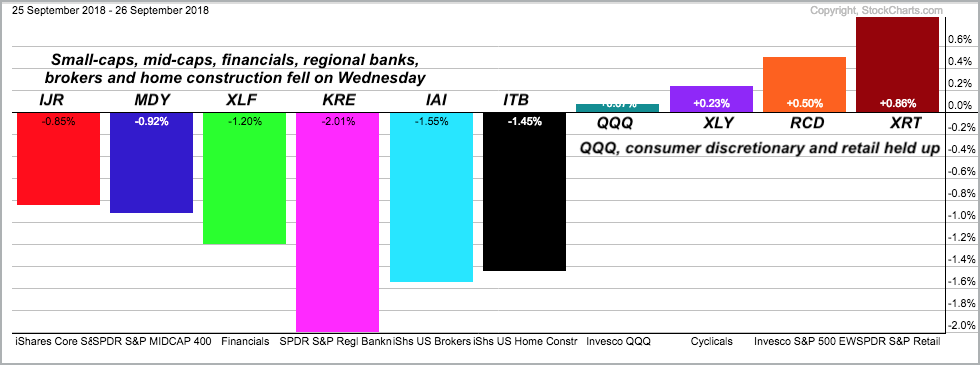
...Stocks were hit with selling pressure late Wednesday and this pushed some key groups modestly lower. The S&P SmallCap iShares (IJR) and Russell 2000 iShares (IWM) led the decline and extended their short-term downtrends with four week lows. The S&P MidCap SPDR (MDY) fell below its mid September low. Weakness in financials weighed on these three as this sector accounts for 17% of IJR, 17.5% of IWM and 16.22% of MDY.
Large-techs held up relatively well as the Nasdaq 100 ETF (QQQ) finished with a small gain. Also note that the Retail SPDR (XRT), the Consumer Discretionary SPDR (XLY) and EW Consumer Discretionary ETF (RCD) ended with gains. Thus, Wednesday was not as bleak as financials and the semiconductors would have us believe.
As noted in detail below, the Financials SPDR, the Regional Bank SPDR, the Broker-Dealer iShares and the Home Construction iShares did not make new highs this summer and have been lagging for much of 2018. This means there are stronger charts out there. And, more importantly, we have a choice.
When it comes to stocks and equity-related ETF, it is often best to focus on strength and avoid weakness.
The tech-related ETFs and QQQ have better looking charts and have led for most of 2018 (see Art's Charts on Wednesday). This is also true for the Health Care SPDR (XLV and healthcare-related ETFs as well as the Industrials SPDR (XLI) and the Aerospace & Defense iShares (ITA).
Finance Sector Fails to Hold Breakout
Last week I was touting the flag breakout and strength in the Financials SPDR (XLF). This week I return with reports of a failed breakout. XLF surged three days with a move above 28.75 last week and plunged the last four days with a close below 28 on Wednesday.
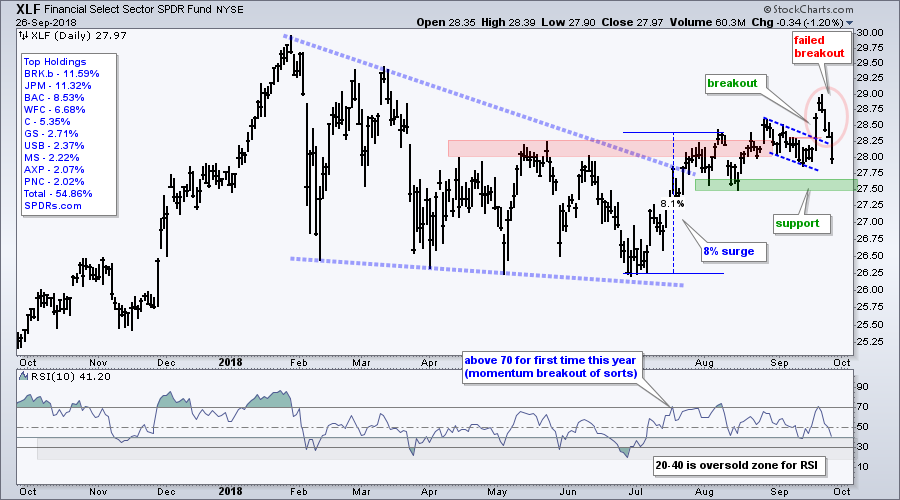
Overall, the Financials SPDR is underperforming in 2018 because it never got clsoe to its January high. In contrast, note that the Technology, Industrials, Healthcare and Consumer Discretionary Sector SPDRs exceeded their January highs in August or September. XLF was the last of the big five sector SPDRs to break out and is it the first to fail. Thus, if ranking the big five sector SPDRs, XLF comes in last place.
Defining the Upswing in XLF
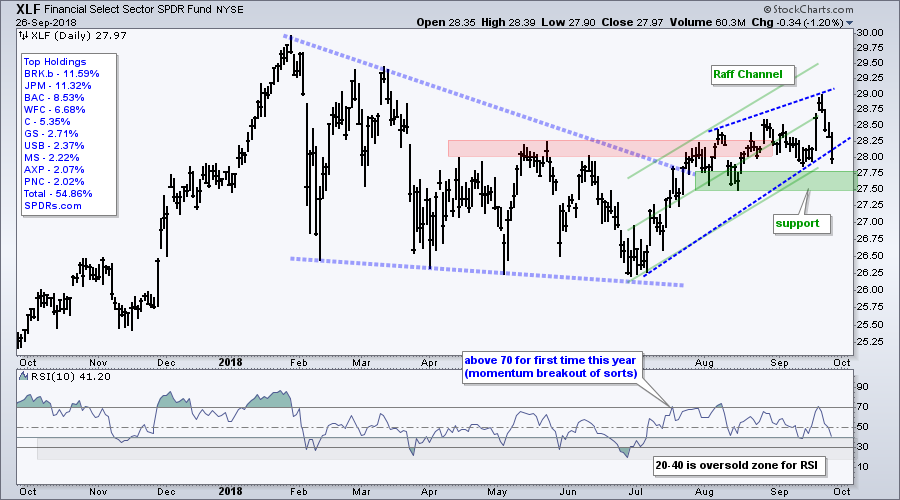
The next chart shows a rising wedge with blue lines and a Raff Regression Channel with green lines. XLF broke the rising wedge line, but I am not sure how robust this line is because of its steepness. The lower line of the Raff Regression Channel ends around 27.8 and the August-September lows mark a support zone in the 27.5-27.75 area. A break here would reverse the uptrend that began in July and weigh further on the broader market. XLF accounts for 13.66% of the S&P 500 and is the third largest sector (XLK = 20.87% and XLV = 14.89%).
Regional Banks and Brokers Break
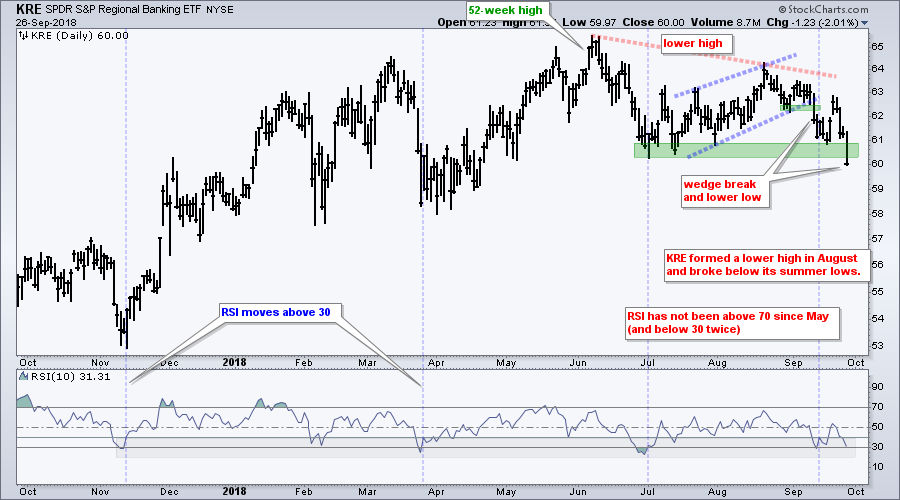
The Regional Bank SPDR (KRE) and the Broker-Dealer iShares (IAI) are leading the finance sector lower. The next chart shows KRE peaking well below its June high and breaking wedge support in mid September. The ETF bounced off support last week, but fell sharply the last three days and broke below the summer lows. This is one of the weakest industry group ETFs right now.
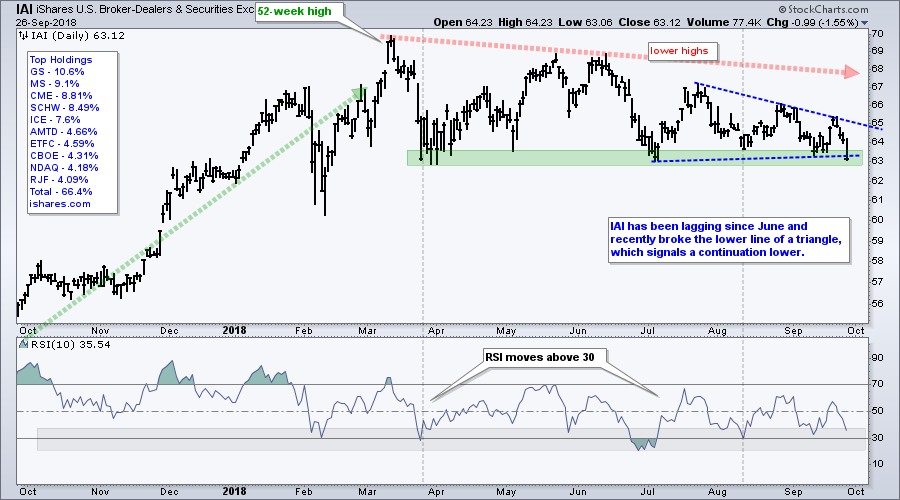
The next chart shows the Broker-Dealer iShares (IAI) forming lower highs in May-June and underperforming the broader market over the last few months. Keep in mind that SPY, IJR and MDY hit new highs in August. IAI barely bounced in August and formed a triangle over the last two months. Wednesday's break below the triangle line signals a continuation of the current downtrend.
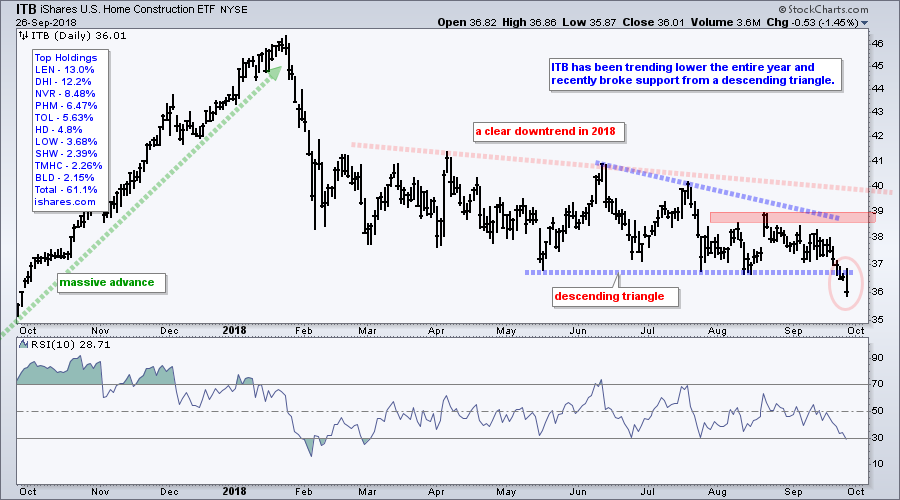
The Home Construction iShares (ITB) peaked in late January, fell sharply into early February and then began to zigzag lower. This is one of the weakest industry group ETFs in 2018 and the ETF just broke to a new low for the year. ITB also broke the lows of a descending triangle and this signals a continuation of the existing downtrend.
Questions, Comments or Feedback?
I cannot promise to response to all correspondence, but I will read it and take into under consideration. I greatly appreciate all feedback because it helps me improve the commentary and provides ideas for the future. Sorry, I do not take symbol requests.

Plan Your Trade and Trade Your Plan.
- Arthur Hill, CMT
Senior Technical Analyst, StockCharts.com
Book: Define the Trend and Trade the Trend
Twitter: Follow @ArthurHill
