Art's Charts August 16, 2021 at 08:11 AM
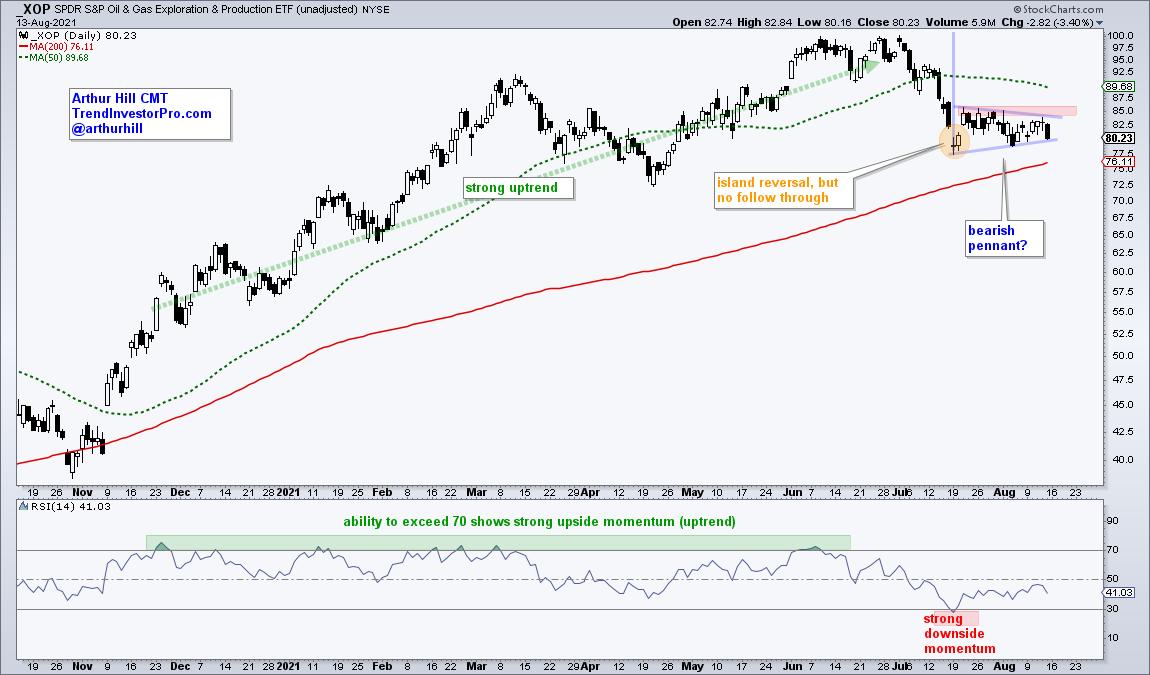
RSI is a momentum oscillator that many chartists use to identify overbought and oversold levels. While RSI above 70 is typically considered an overbought condition, it is also a sign of strong upside momentum that can signal the start of an extended advance... Read More