Art's Charts February 25, 2023 at 08:14 AM
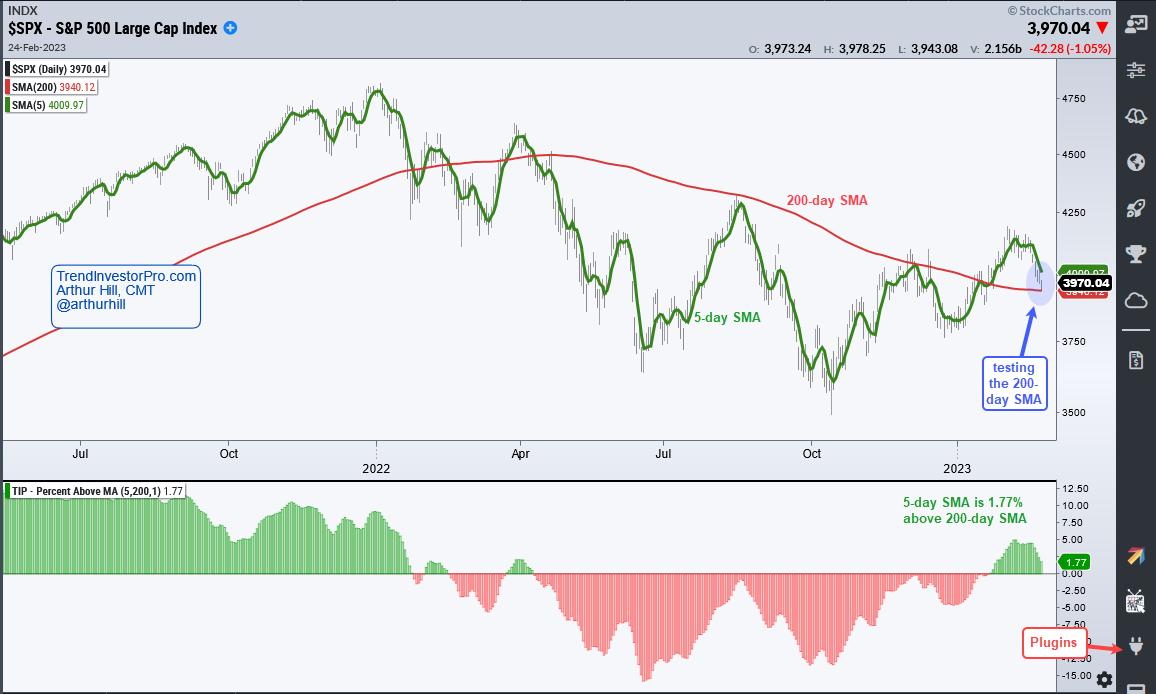
The stock market has been a tough place for trend-following since January 2022, which is when the S&P 500 first triggered a bearish trend signal. The bearish signal in question is the humble 5/200 day SMA cross... Read More
Art's Charts February 17, 2023 at 03:02 PM
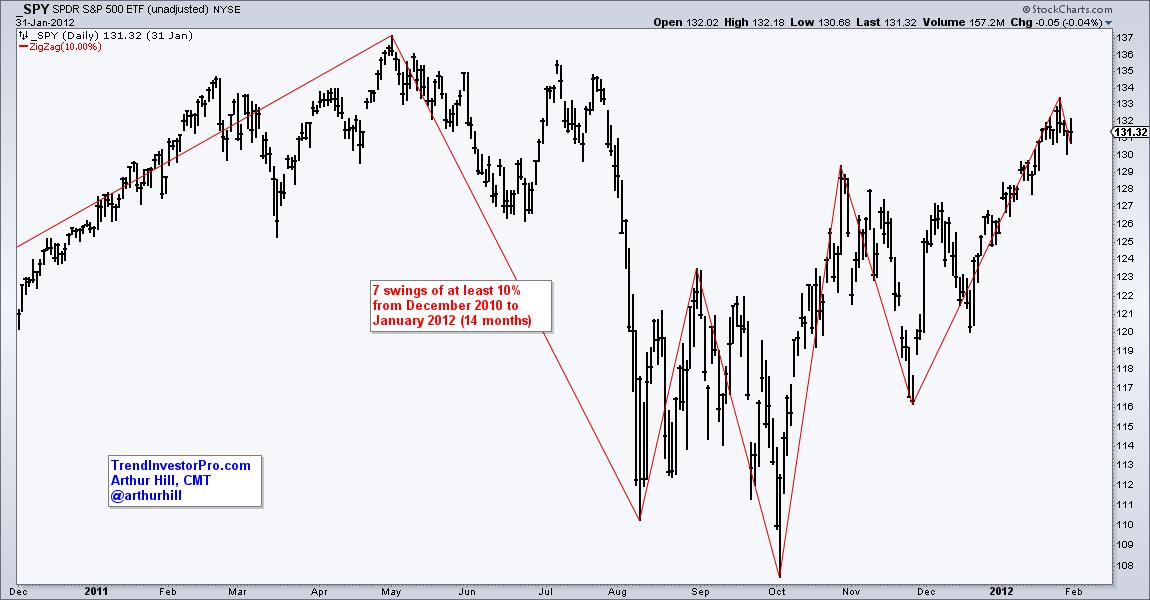
The S&P 500 SPDR (SPY) is a period of big swings and above average volatility. There were six swings of at least 10% from late January to early February 2023. Looking at other 12-14 month periods, this is the fourth most in the last 23 years... Read More
Art's Charts February 12, 2023 at 05:29 AM

Stocks went on a tear from late December to early February with the SPDR S&P 500 ETF (SPY) advancing some 11% from low to high. SPY then pulled back last week with a 2.5% decline from the February 2 high to the 10-February 10 low... Read More