Art's Charts May 31, 2023 at 12:07 PM
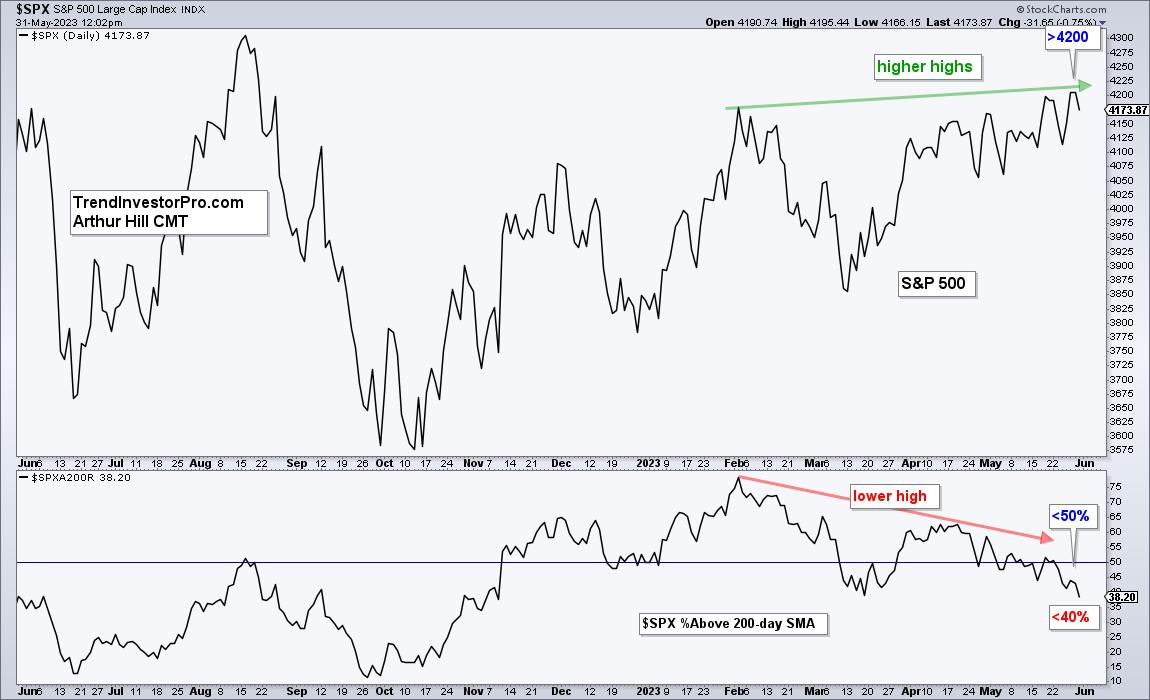
The S&P 500 recently moved above its February high to extend its uptrend, but all is not well under the surface. Fewer stocks are participating in the May advance and a key breadth indicator formed a bearish divergence... Read More
Art's Charts May 26, 2023 at 08:23 AM

My research suggests that profit targets improve results for trend-momentum strategies that trade ETFs. Note that performance improvements may differ for other strategies. This article will first show a trend-momentum setup on the chart... Read More
Art's Charts May 19, 2023 at 07:34 AM
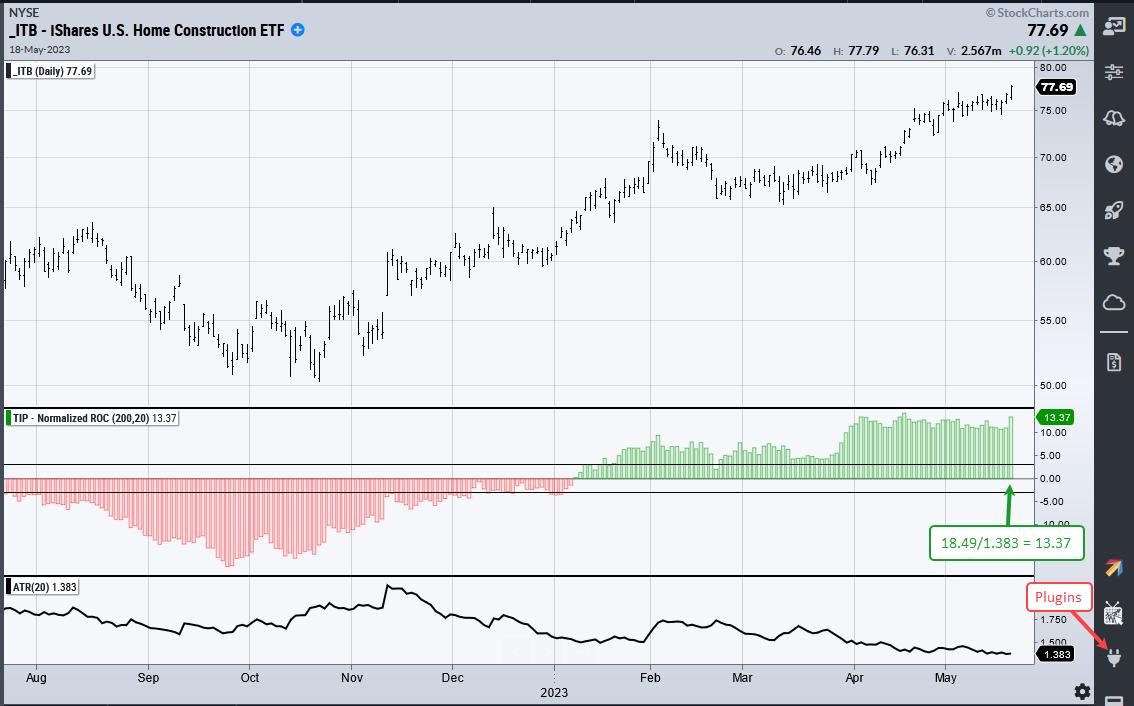
Chartists can find leaders by ranking ETF performance in ATR multiples, and there is even an indicator for that. Normalized-ROC puts point performance in ATR multiples and we can compare these values against others... Read More
Art's Charts May 12, 2023 at 11:29 AM

Chartists looking for momentum leaders should consider more than one timeframe. A stock may be leading over the last 200 days, but lagging over the last 100 days. Similarly, a stock could show big gains the last 100 days, but still be down over the last 200 days... Read More