Art's Charts September 28, 2023 at 10:40 AM
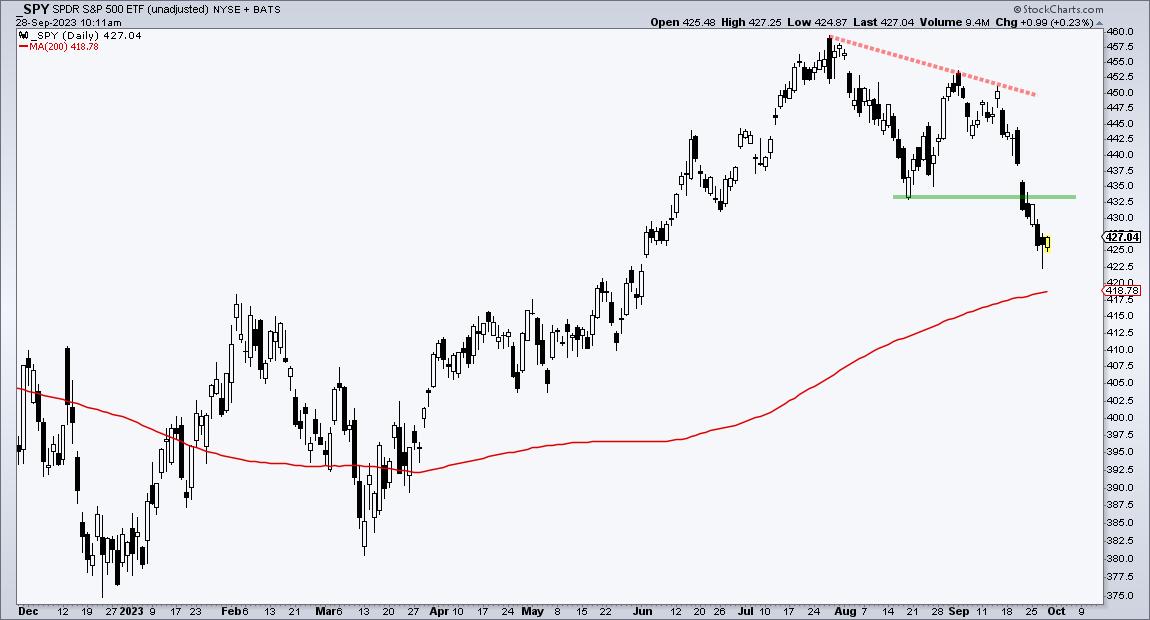
Stocks were hit hard the last two weeks with the S&P 500 SPDR (SPY) breaking below its August low. SPY also forged a lower high from July to August. Stocks and ETFs that held above their August lows are showing relative strength... Read More
Art's Charts September 26, 2023 at 09:40 AM
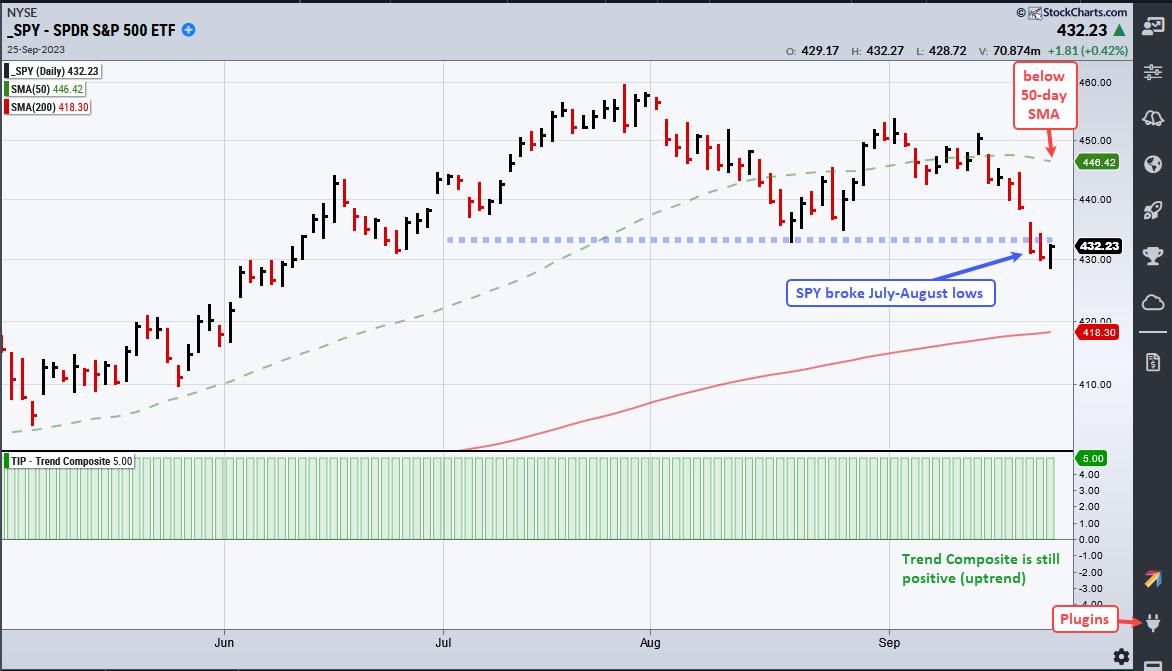
Stocks fell sharply in September with the S&P 500 SPDR (SPY) breaking below its August low. Chartists can now use this low as a benchmark low to gauge relative performance. Stocks that held above the August low are showing relative strength... Read More
Art's Charts September 21, 2023 at 09:38 AM
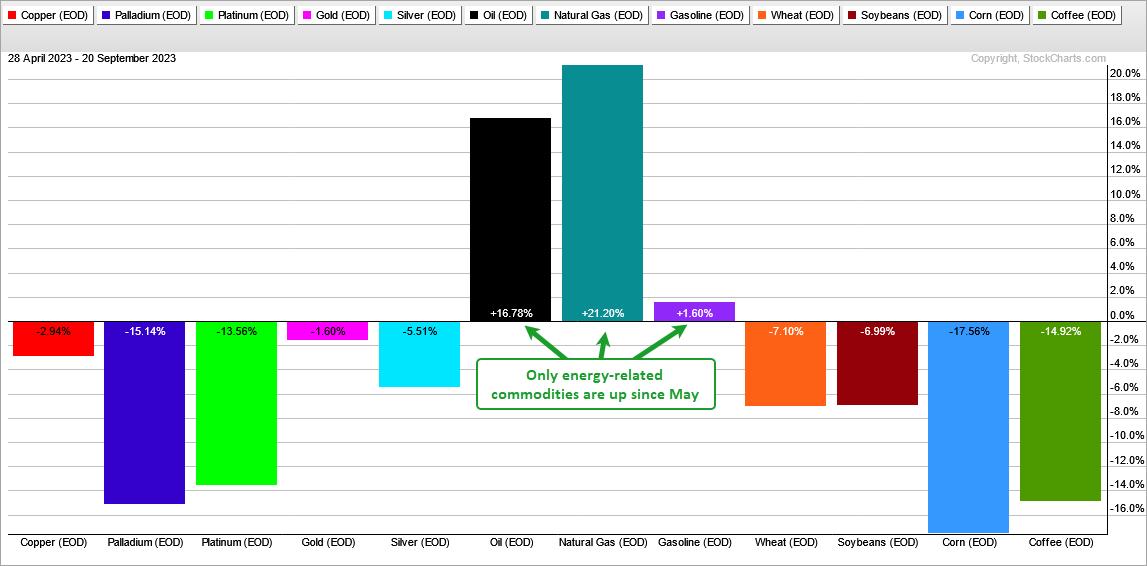
It has been a rough ride for most commodities this year and especially over the last 100 trading days (since May). Of the twelve spot prices I track, nine are up and three are down. Precious metals, base metals, lumber and grains are all down... Read More
Art's Charts September 19, 2023 at 10:35 AM
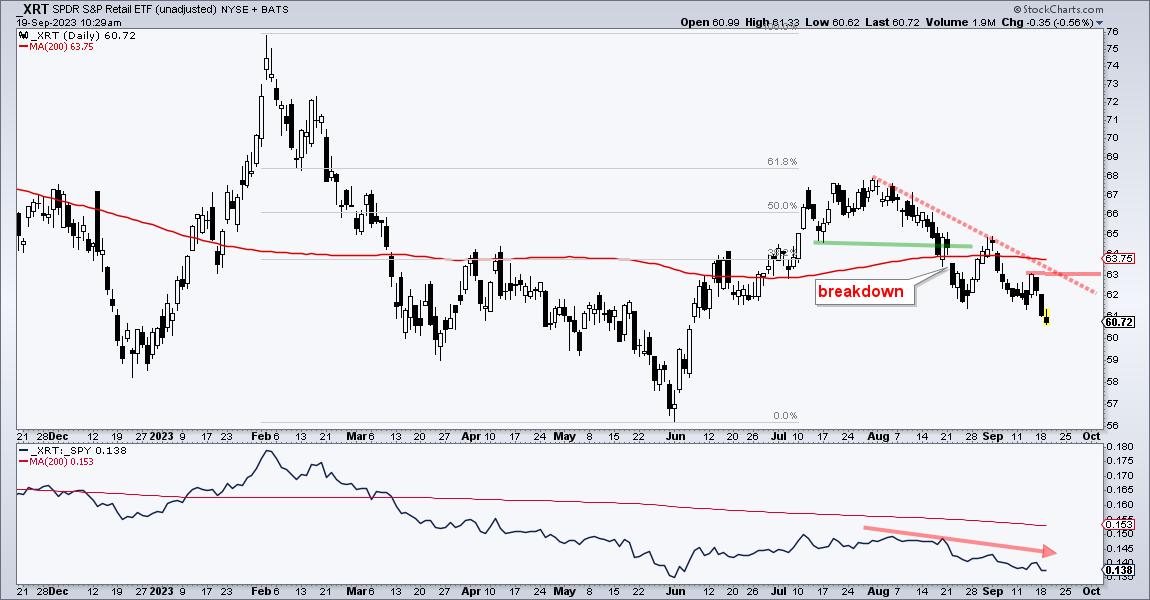
A few large-caps and large-cap techs are holding up, but other areas of the market are showing weakness. Namely, the Retail SPDR (XRT) and Regional Bank ETF (KRE) are two of the weakest groups right now... Read More
Art's Charts September 14, 2023 at 09:41 AM
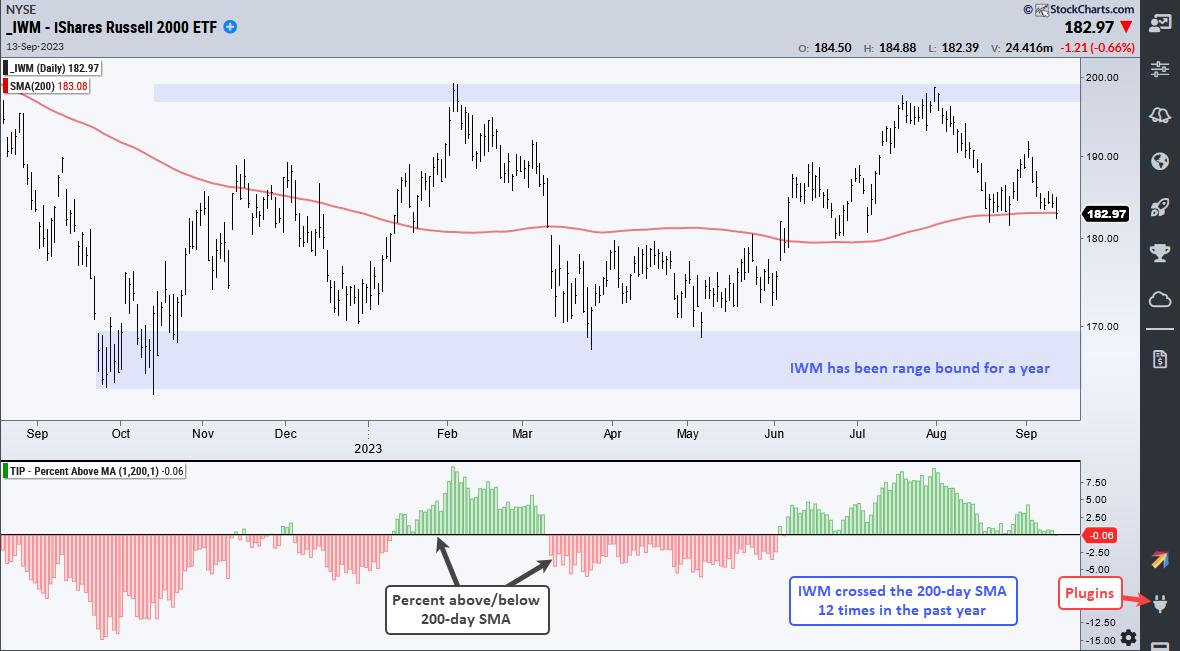
The Russell 2000 ETF (IWM) closed below the 200-day SMA for the first time since, well, June 1st. The last cross was not that long ago and recent crosses simply resulted in whipsaws. Truth be told, 200-day SMA crosses are not that relevant for IWM... Read More
Art's Charts September 12, 2023 at 11:15 AM
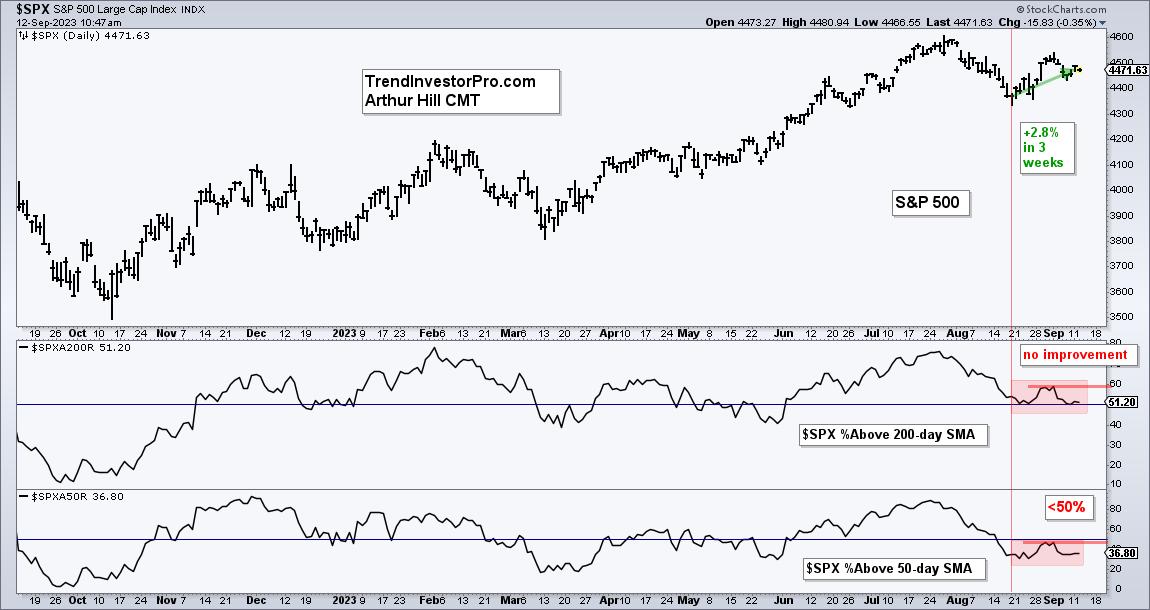
The S&P 500 SPDR bounced the last three weeks, but we did not see an improvement in breadth. Weak breadth is also reflected in performance for mid-caps and small-caps, which are lagging. Even so, SPY and QQQ are in short-term uptrends and I am watching the tech sector for clues... Read More
Art's Charts September 06, 2023 at 08:39 AM
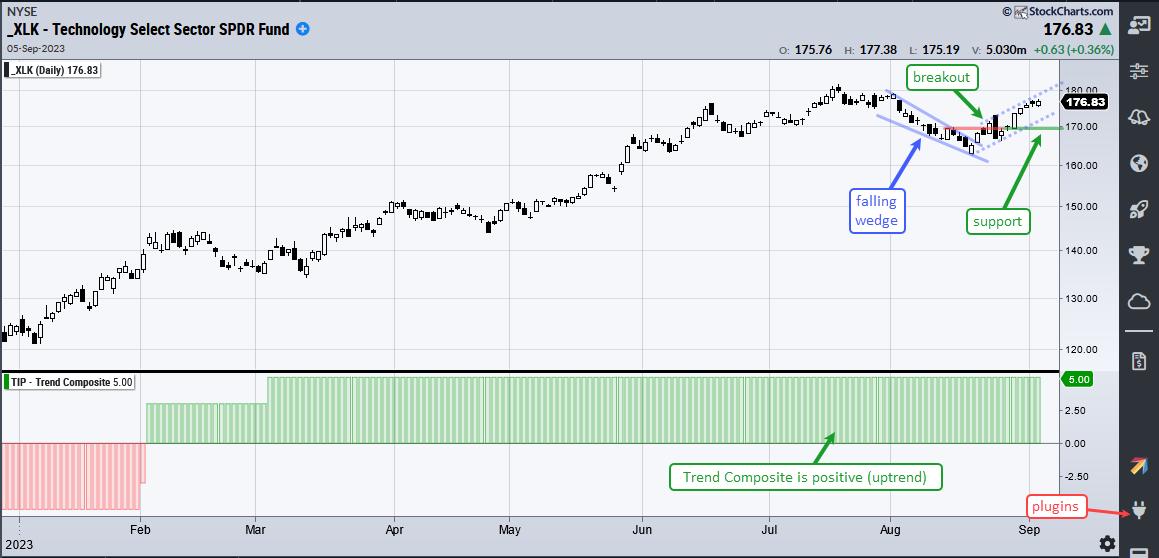
Stocks surged in the second half of August with several ETFs breaking out of corrective patterns, such as falling flags or falling wedges. Even though September is a seasonally weak month, these breakouts are bullish until proven otherwise... Read More
Art's Charts September 02, 2023 at 09:40 AM
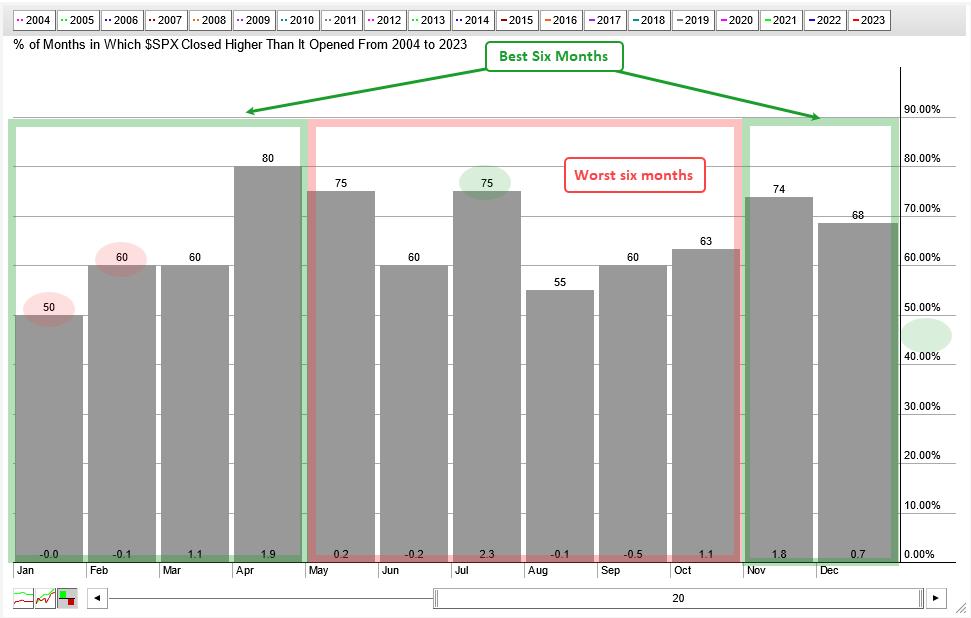
There is some validity to the best six months strategy, but investors would probably be better off with a simple timing tool. According to the Stock Trader's Almanac, the best six-month period runs from November to April. The worst six-month period runs from May to October... Read More