Art's Charts November 26, 2023 at 11:21 AM
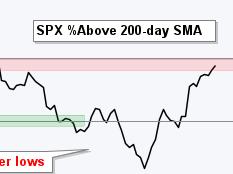
The percentage of stocks in long-term uptrends rebounded sharply in November and returned to the highs from late August and early September. This rebound is impressive, but the absolute levels are still not that inspiring... Read More
Art's Charts November 18, 2023 at 04:45 PM
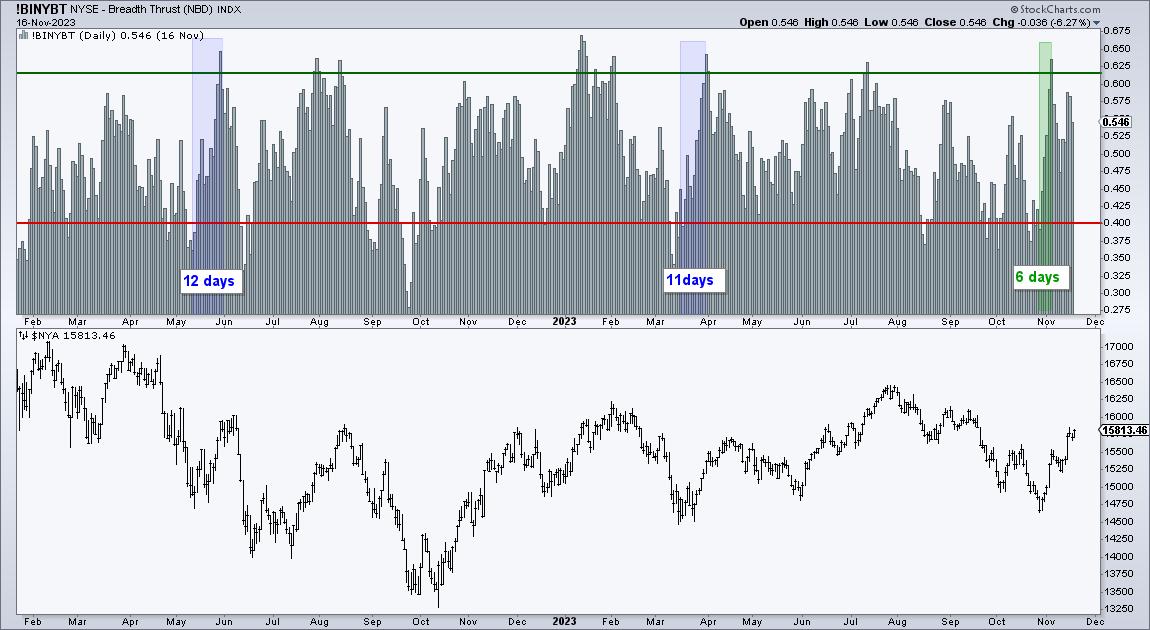
StockCharts users can chart the Zweig Breadth Thrust for the S&P 1500 or any other index that has Advance-Decline Percent data. All we have to do its convert the Zweig Breadth Thrust levels to their equivalents using Advance-Decline Percent... Read More
Art's Charts November 11, 2023 at 08:22 AM

Today's report features the Zweig Breadth Thrust, which was developed by the late, and great, Marty Zweig. Zweig appeared regularly on Wall Street Week, contributed to Barrons, published The Zweig Forecast and wrote Winning on Wall Street in 1986... Read More
Art's Charts November 04, 2023 at 11:55 AM
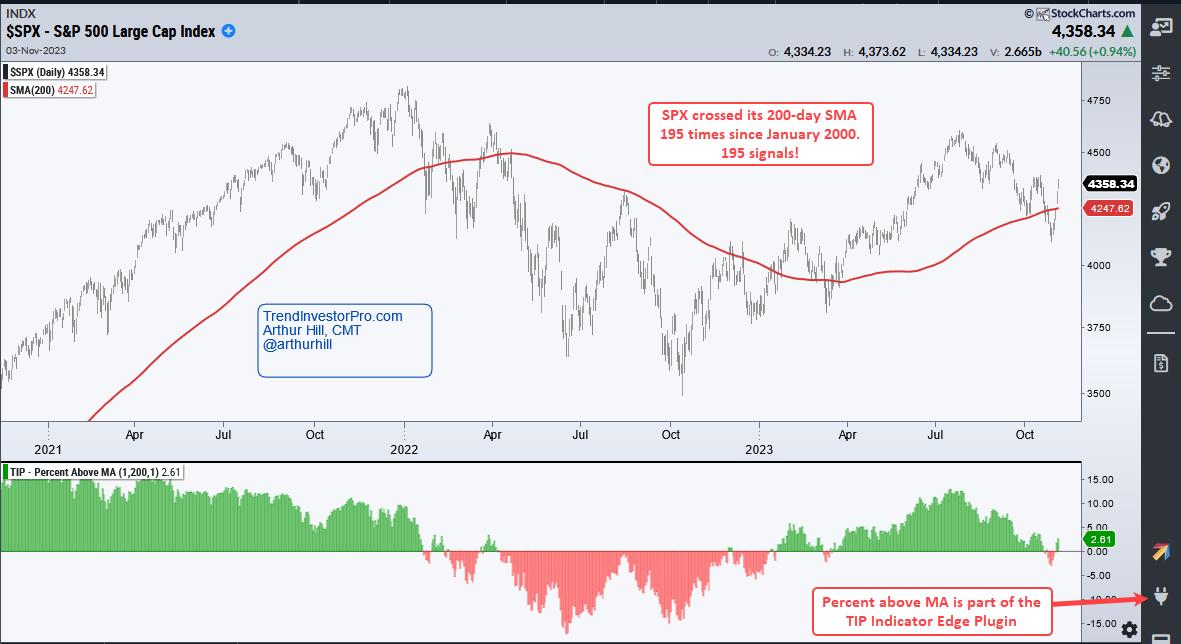
The S&P 500 is battling the 200-day SMA with four crosses over the last eleven days. We are also seeing a rise in volatility as this market benchmark plunged 5.86% in nine days (18-27 October) and then surged 5.85% the last five days... Read More