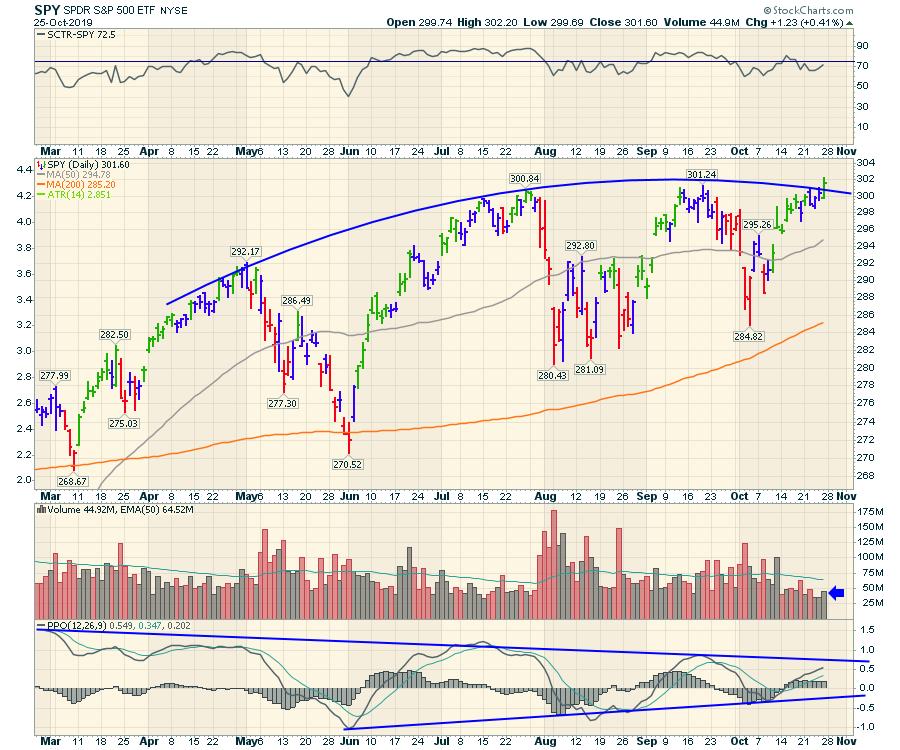
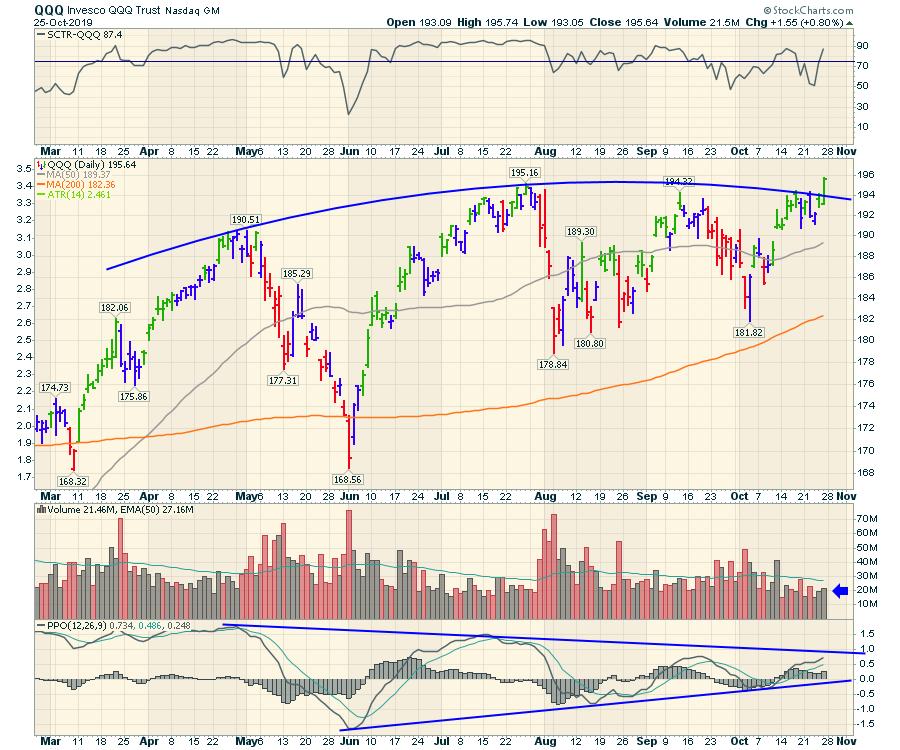
After 7 days of trying to break above, we finally notched new highs on the $NDX! I kept wondering if we would ever get to the land of the new high ground! Apple (AAPL) was one of the stocks powering higher, giving us a path over the zone of resistance. The SPY ETF tracks the S&P 500 and includes dividends; that chart made a new high, but the $SPX came up just short.

On the video, I mentioned the $SPX made a new high, but I was wrong, as it was a fraction short. It was the SPY (that includes dividends) that made the new high.
As with all good things, we now need to see the market not fall back down again! These new highs have been fleeting, so next week will be important to see if we can stay at new highs through the Fed meeting and month end. There is always something to watch for!
Here is the SPY chart on the back of a busy week of earnings:
The Nasdaq 100 was even more powerful, closing almost on the highs. That is pretty bullish!
On this weekend's video, I worked through strong stocks within the Consumer Discretionary (XLY). The XLY is one of the strongest indicators on the consumer, and the chart is weakening on the SCTR. I have three volume lines on the volume chart, but they all tell the same story: volume is declining. The momentum shown on the PPO is rolling over, as the previous test of the high came up short.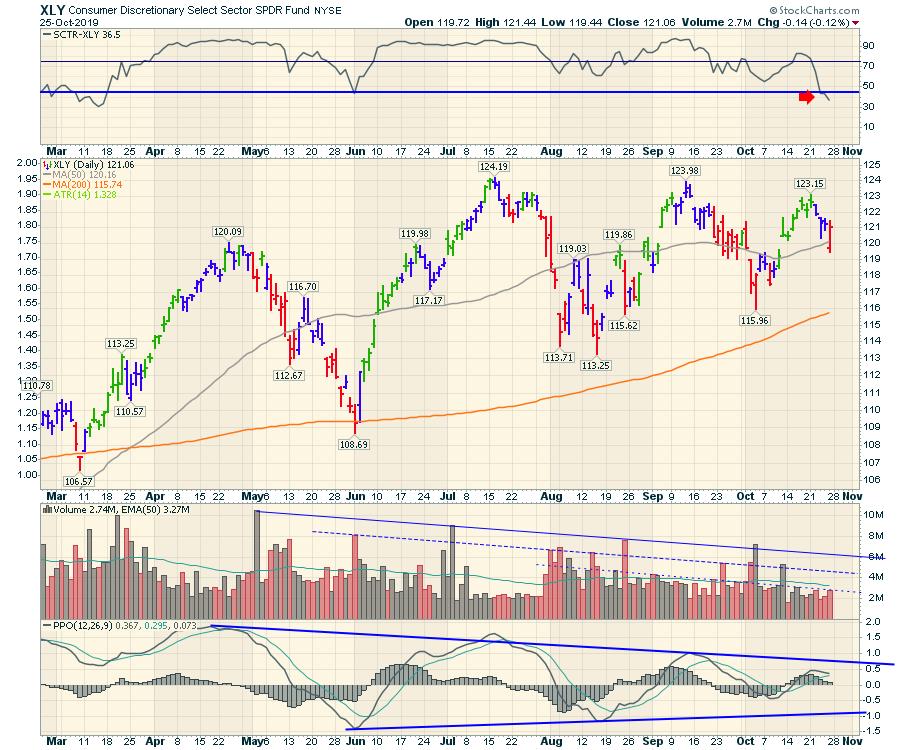
There were lots of charts within the sector outperforming the S&P 500 over the last three months. In general, however, the chart above says the average discretionary stock is oscillating sideways. This is shown by each wave of the PPO having lower momentum and shorter waves.
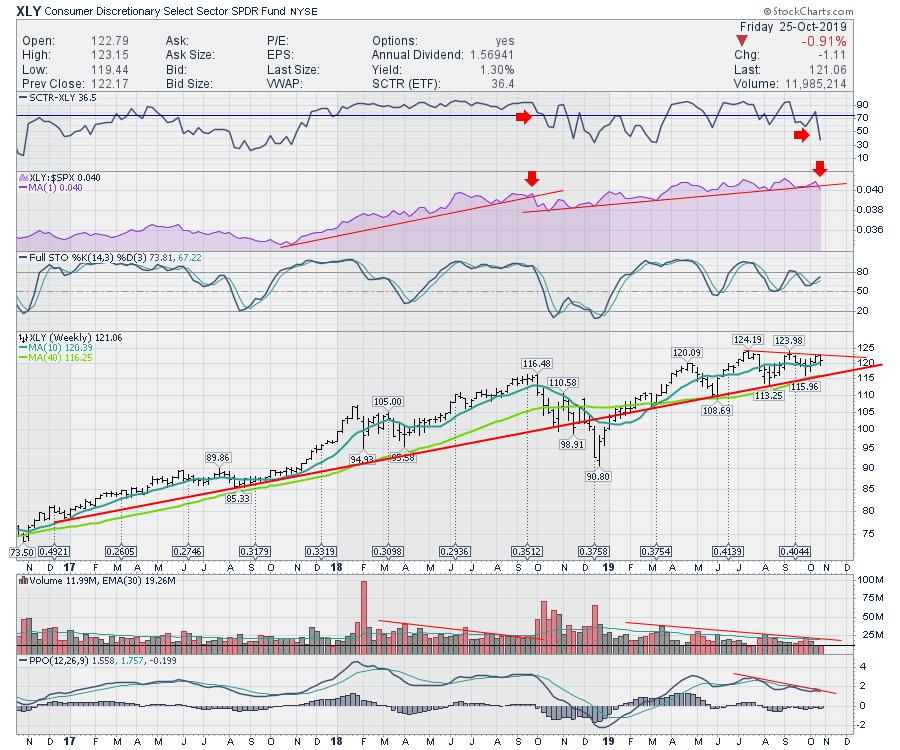
The weekly chart looks equally difficult. The Relative Strength trend line shown in purple broke the year-long trend this week. I will point out the SCTR ranking is at a very low level that it does not usually exist at. The question is, will it bounce right here and break out to new highs as it surges higher, or is it telling us the same as the September 21st, 2018 top? In the case of the latter, the low SCTR reading, low volume and the break in relative strength support marked a meaningful move lower. The move lower happened on the XLY, as well as the $SPX, $NDX and $RUT. It's an important time to pay attention.
I used a black line to highlight this week's volume. The level was 11.99 million shares. Last week, the volume was even lower, at just 11.55 million. These are very low levels. These volumes are way lower than most vacation weeks, like Thanksgiving or Christmas. There are only three other weeks in the last few years with lower volume. The most recent ones, in July and April, both had low volumes just before the market dropped. The last two weeks have some of the lowest volumes on the three years on the chart. Two of those low volume weeks were the vacation levels in 2017. It's definitely the calm before an upside breakout storm - or a complete backing away before the drop. I don't expect volumes to stay this low. My gut says lower, as the SCTR is making lower lows and lower highs.
While I want to be extremely bullish, with the market indexes testing and breaking out to new highs, I think this important group has major warning signs flashing.
Here is a link to this week's video, New Highs!
 The Bridge to New Highs!
It's an important week to stay focused on which industry groups are working.
Founders Sale:
If you would like to subscribe to my new content platform on GregSchnell.com, If you are interested in subscribing:
- Go to the Private Clients tab on GregSchnell.com
- Select the Annual membership in the red area
- Click through to the payment page, add details
You will receive one strong, concise email per week. THE LINKS TO THE WEEKLY VIDEO AND THE CHARTLIST ARE BOTH INCLUDED IN THE PDF.
The email will contain:
1) A PDF file that will have my top ten charts of the week. This is to summarize all of the work I go through every week and give you the best information on market direction.
This will also include my preferred opinion on the market: very aggressive, moderately aggressive, selective, defensive, very defensive. We want to be aggressive coming out of major lows. These runs can last a few weeks to months and perhaps more than a year. I will be investing in the same tone I am recommending.
2) The weekly video which summarizes the major moves in the USA, Canada, rest of world, commodities, bonds and currencies including:
Commodities: Copper, Steel, Rare Earth Metals, Lithium, Gold, Silver, Oil and Natural Gas, Marijuana.
Bonds: 3-month, 2-year, 5-year, 10-year, 30-year.
Equities: The protection of capital to miss the big downside moves, as well as the aggressive entries near the lows to maximize profits in the moves and keeping it as profit in your portfolio. A large part of my work is about making sure that you'll be in tune with the major moves in the indexes.
Currencies: A comprehensive look at the major currency pairs every week. These pairs can drive some of the major changes in world economics. Being aware of these changes when they occur can help you position for new strategies and selections as the changes happen.
Global markets are important to support major uptrends in the North American markets. A summary of this information enables you to be aware of country ETFs that are doing well to help you diversify your portfolio across global markets.
Again, the purpose of the subscription service is to give you a concise one-hour video of information to keep you abreast of the long term trends and places to look for big setups. This is not a daily suggestion box or a chat facility. It is for serious investors, with small or large amounts of capital to deploy so that you know when the positive winds are at your back while looking for gains and protecting capital.
Enjoy your week!
Good trading,
Greg Schnell, CMT, MFTA
Senior Technical Analyst, StockCharts.com
Author, Stock Charts For Dummies
Want to stay on top of the market's latest intermarket signals?
– Follow @SchnellInvestor on Twitter
– Connect with Greg on LinkedIn
– Subscribe to The Canadian Technician
– Email at info@gregschnell.com