Hello Fellow ChartWatchers!
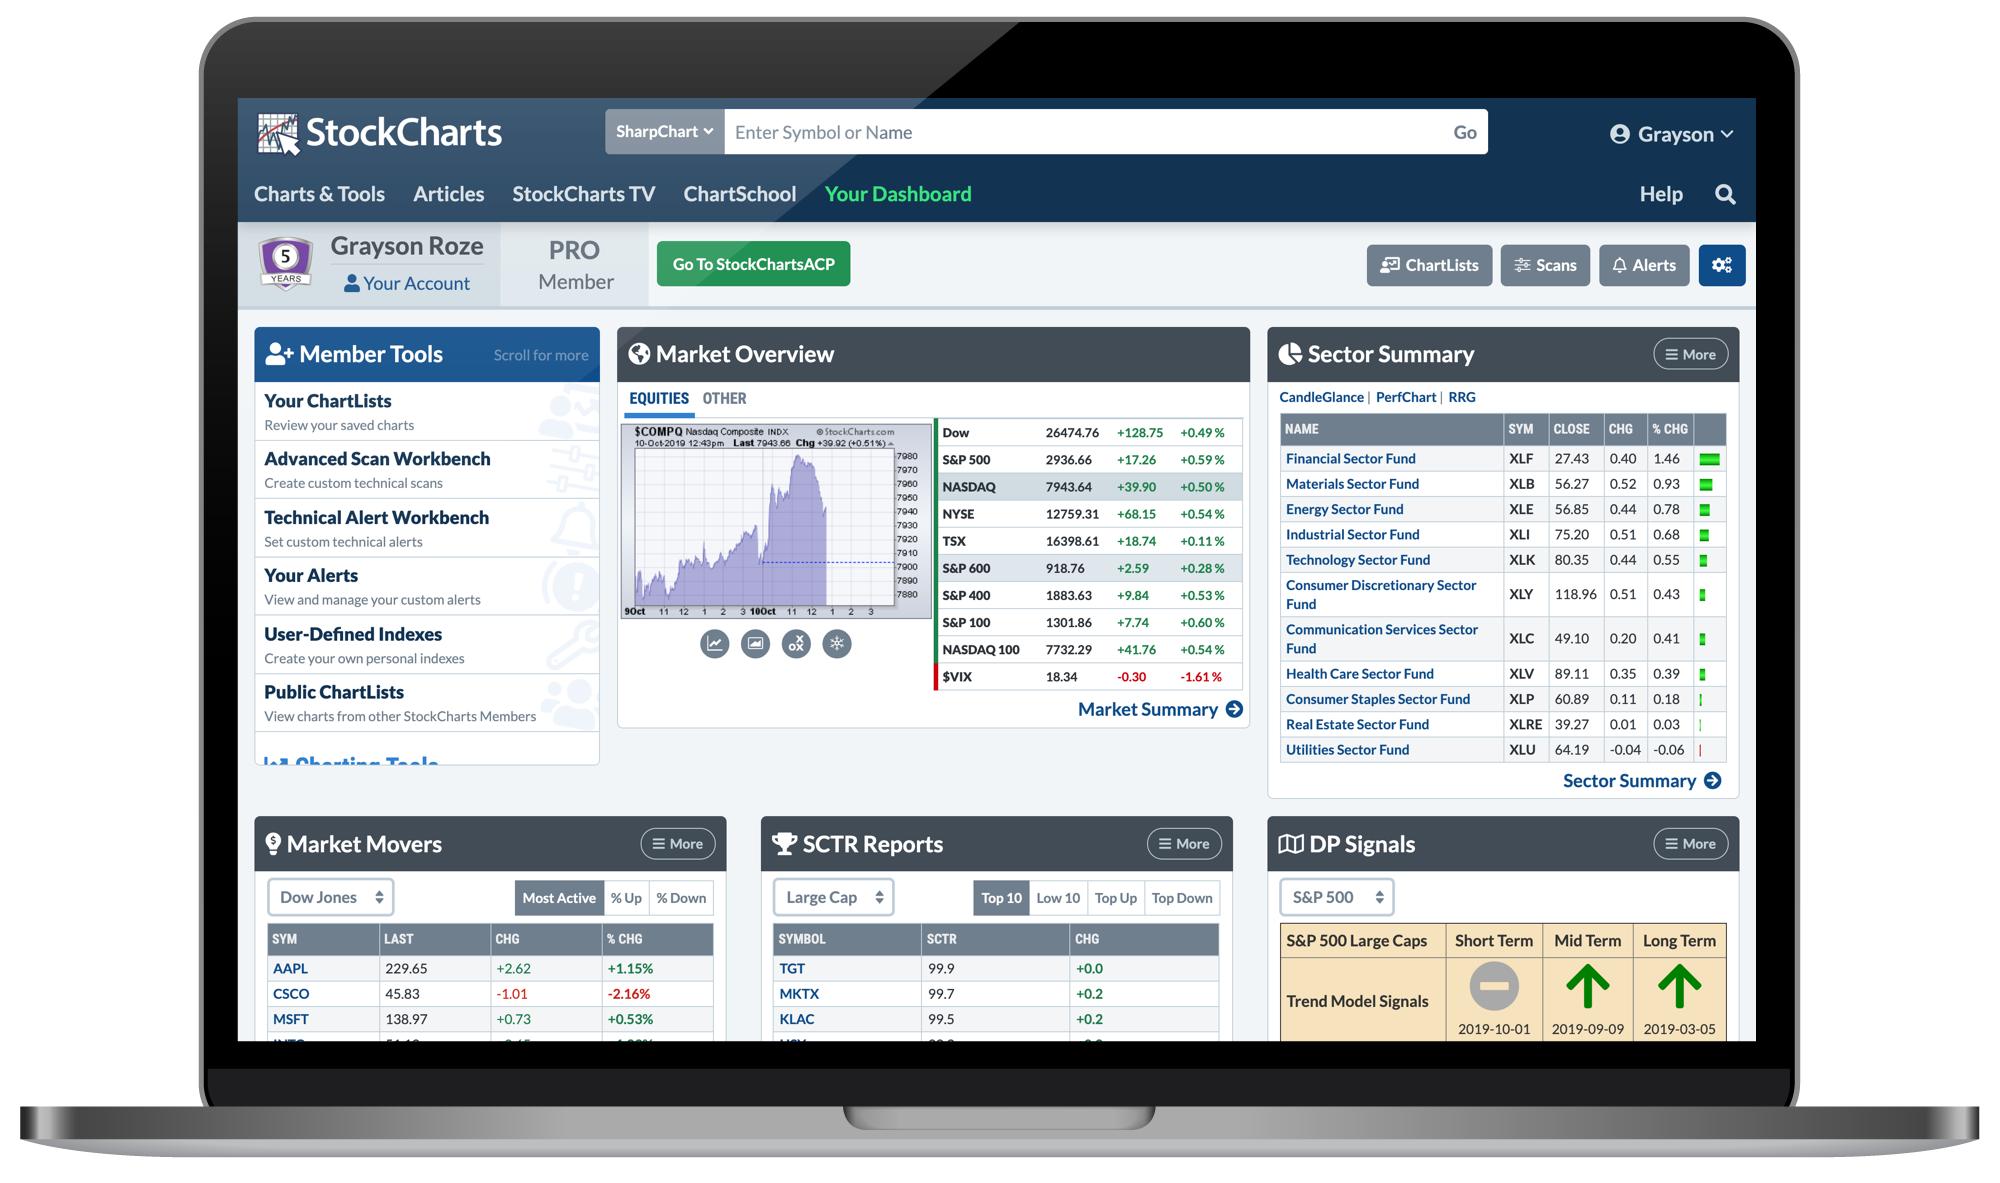
Earlier this week, we released another round of upgrades and additions to your StockCharts Dashboard. I've always referred to the Dashboard as "the heart and soul of your StockCharts account". Sure, it provides easy access to our many tools and features via the "Member Tools" panel, but that's only the beginning. There's much more to uncover on this page, and our latest additions have made it even more powerful for you.
As you'll hear more about below, the latest Dashboard updates include:
- A totally revamped Market Overview panel with more data than ever before
- A Sector Summary option for the data panels on Your Dashboard
- The ability to add new symbols to your top ChartLists right from the page
- A Latest Articles panel that includes recently-published articles on StockCharts
- A StockCharts TV panel with the live player and a quick link to new episodes
Now, one quick note before we dive in. I want to remind you that the layout of the Dashboard is actually very customizable. You can tailor Your Dashboard to fit your preferences and set it up to match the way that you want to watch the markets. With just a few clicks, the Dashboard can give you an intelligent overview of what's leading the major indexes and which stocks are making moves on the SCTR rankings. You can keep an eye on the predefined alerts or track the latest DecisionPoint signals. Plus, you get quick access to your saved ChartLists, custom scans and technical alerts – all from one page.
So, let's take a quick look at what's new on Your Dashboard and show you how to explore the latest features.
Bigger, Better, Broader Market Overview
First and foremost, Your Dashboard now includes a totally revamped Market Overview panel with an improved chart and a much larger collection of summarized indexes. The tabs above the chart allow you to switch between the major equity indexes, which now includes the S&P 600, S&P 400, NASDAQ 100 and the VIX. The "Other" group includes bond yields, the TLT, gold, oil, the US dollar and more.
Click on any row in the Market Overview table to see the corresponding chart for that index or ETF. You can also use the grey buttons below the chart to launch some our other views, like SharpCharts, GalleryView or Seasonality.
Most importantly, the Market Overview panel will continue grow and improve over time as we add new groups and other indexes. For example, we'll be rolling out a new "Crypto" tab very soon!
"Sector Summary" in the Data Panels
To complement our ever-popular Sector Summary page (where you can drill down from the 11 major market sectors through the respective industry groups to the stocks within), we've added a Sector Summary view to the data panels of Your Dashboard. At a glance, you can see how all 11 sector funds are moving, following the leaders and laggards without ever leaving the Dashboard. Plus, quick links above the table take you right to the PerfChart, CandleGlance or RRG views for the full sector group.
By default, the top row of Your Dashboard shows a Market Movers panel with the most active stocks in the Dow. Click the "More" button in the top right corner of that panel and you'll see a list of other available views, like SCTR Reports, Ticker Cloud, Predefined Alerts and the new Sector Summary.
Now, here's the best part – the data panels on Your Dashboard are actually "sticky", so your most recently selected display will be waiting for you the next time you return to the page. You can set up the Dashboard with the panels that you are most interested in and we'll automatically keep those selections in place in the future. In this way, you can really make the Dashboard your own and customize it to fit your preferred market view.
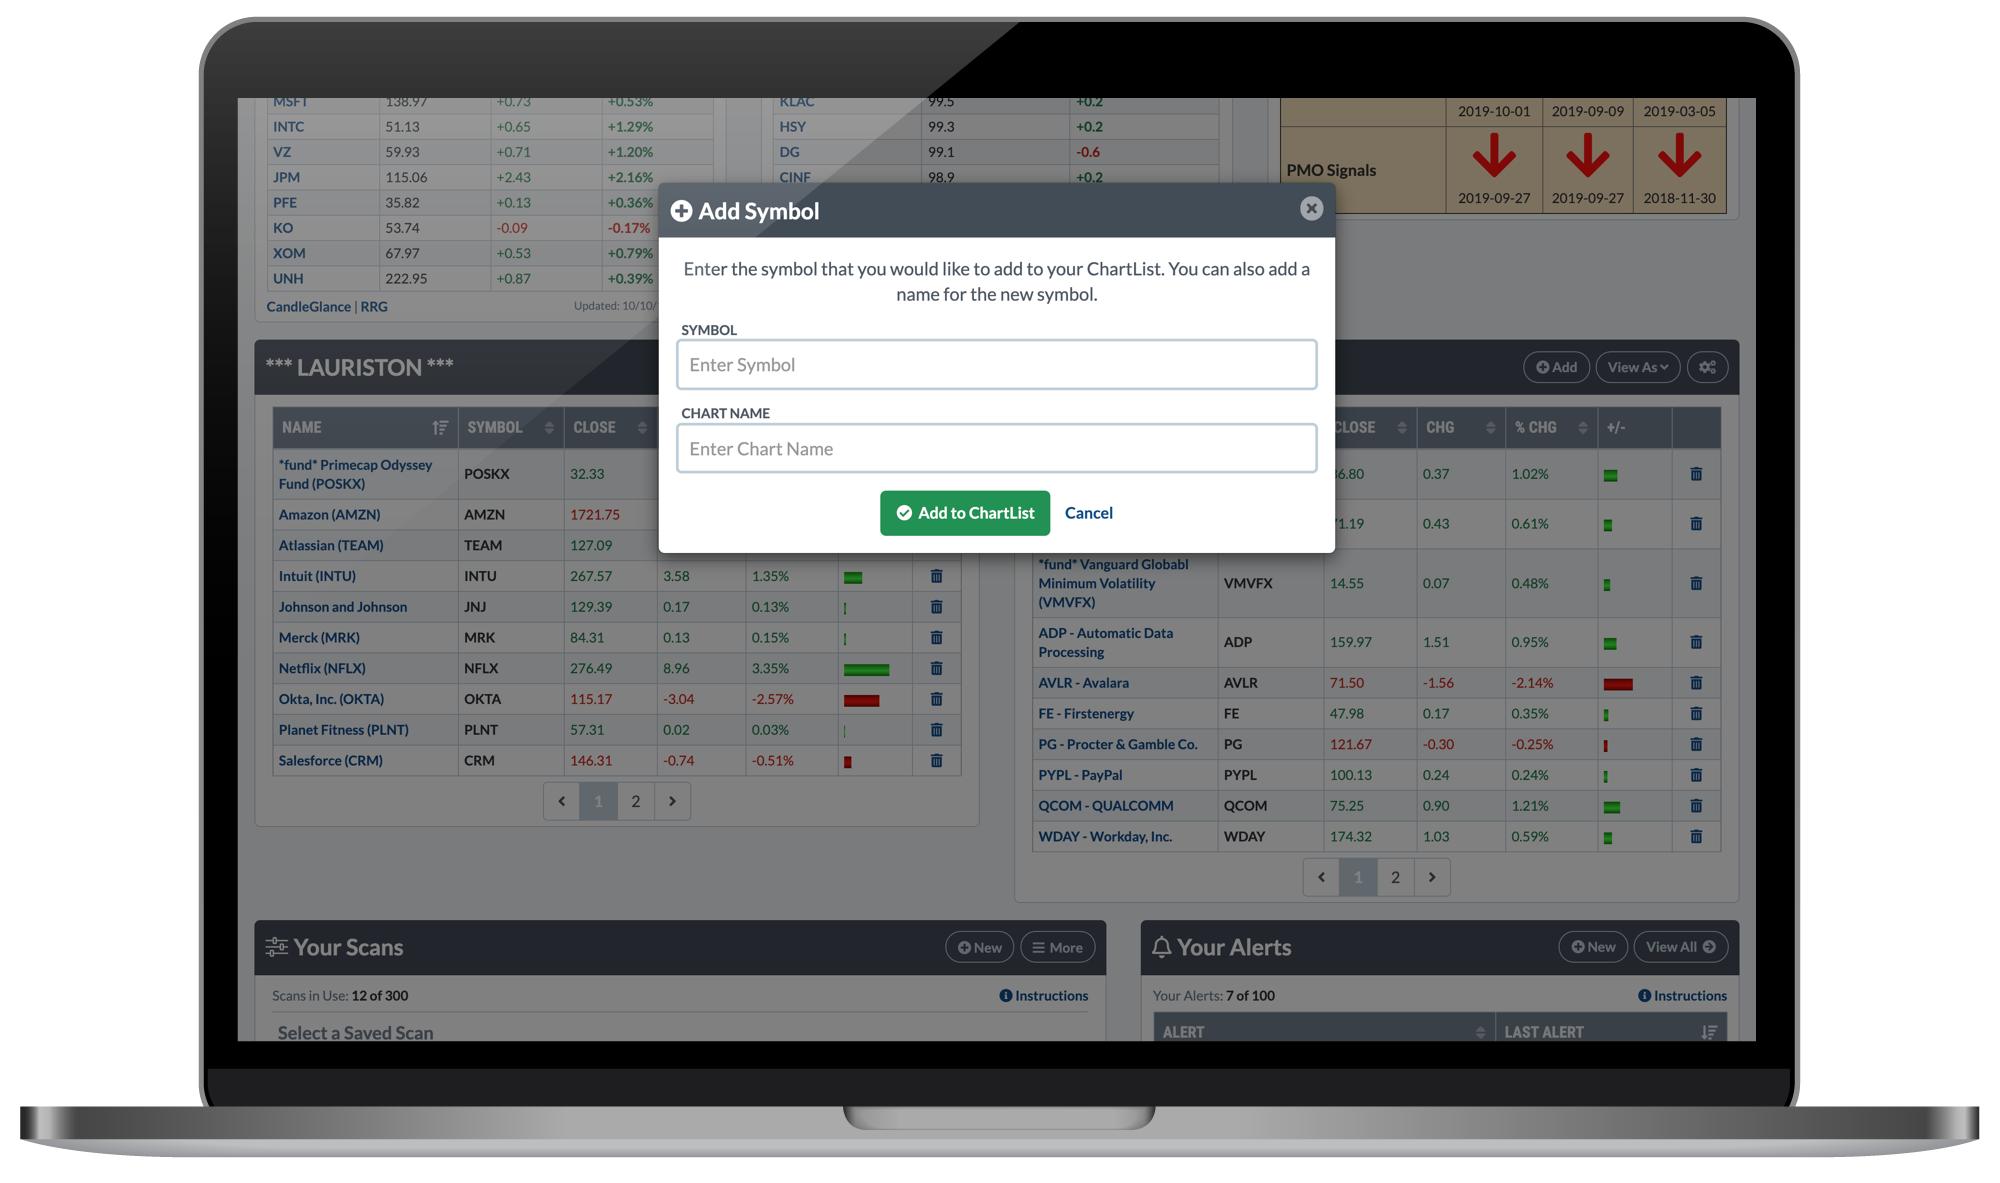
Add New Symbols to Your Top ChartLists
Personally, one of my favorite features of the Dashboard is the optional "ChartList Panels", which allow you to select two of your top ChartLists and see performance summaries of the stocks and funds within, right from Your Dashboard. For example, I have two of my portfolios selected in this row, so without having to click all the way into the ChartLists, I can see what my positions are doing today. As all of us do, I watch the stocks and funds that I own more closely than anything else, so the ability to track those holdings in these two ChartLists right on my Dashboard is a major benefit.
To enhance this feature even more, we've now rolled out the ability to quickly add new symbols to the top ChartLists you've selected. Look for the "Add" button at the top of the ChartList panels, give it a click, and a window will pop up where you can enter any new symbol that you'd like to add to the ChartList.
If you don't already have the optional "ChartList Panels" row switched on for Your Dashboard, I strongly recommend you give it a shot. To do so, click the blue button with the gears icon in the top right corner of Your Dashboard. In the pop up that appears, make sure the "ChartList Panels" option is checked, then hit "Save Preferences".
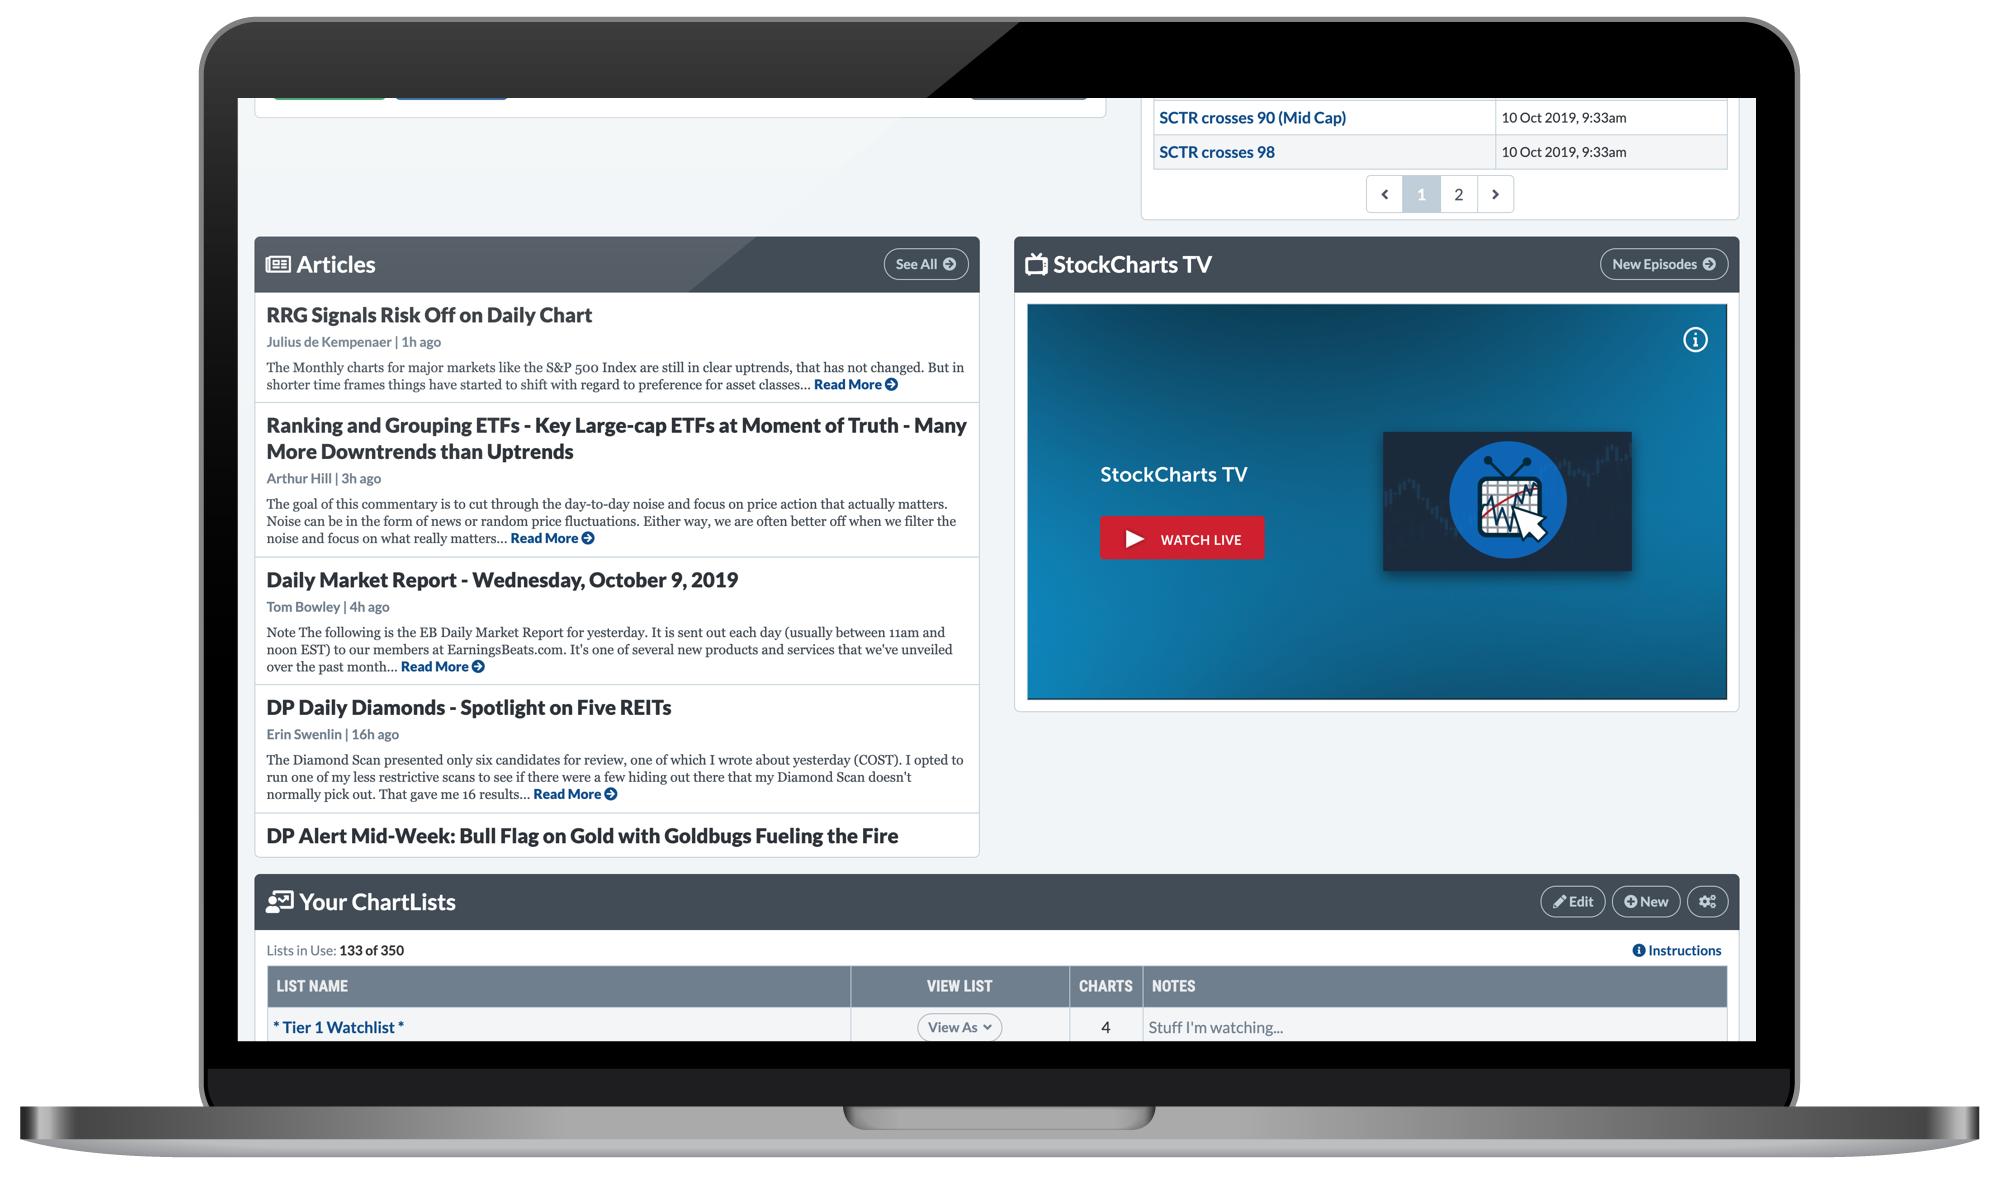
Latest Articles with the "Commentary" Row
Included in a new "Commentary" row that you can select in your dashboard preferences, we've added a panel that features the latest articles published on StockCharts by our team of expert contributors. This makes it easier than ever before to stay on top of this exclusive content and see how some of the industry's best and brightest technical minds are charting the markets.
To turn on the new "Commentary" row and see the Latest Articles panel, click the blue button with the gears icon in the top right corner of Your Dashboard. In the pop up that appears, make sure the "Commentary" option is checked, then hit "Save Preferences".
AND StockCharts TV on Your Dashboard
In addition to the latest articles, the new "Commentary" row includes a panel with StockCharts TV. Right from Your Dashboard, you can tune into our 24/7 video channel dedicated to technical analysis. Watch everything that's streaming live, or click the "New Episodes" button to easily catch up on the latest content.
With the recent launch of our Fall Lineup earlier month, we have new shows from David Keller, Larry Williams, Dave Landry, Tom Bowley and Julius de Kempenaer. The StockCharts TV dashboard panel allows you to stay on top of it all and never miss a thing.
Just like the latest articles, you can see the StockCharts TV panel by turning on the new "Commentary" row in your dashboard preferences. Click the blue button with the gears icon in the top right corner of Your Dashboard, then make sure the "Commentary" option is checked in the pop up that appears.
Now, if you're not a StockCharts Member but these new features sound intriguing, I have good news for you. You can explore everything that our Members Dashboard has to offer as part of your free 1-month trial. Sign up now and in minutes, you'll be customizing dashboard panels just the way you like 'em. To get started and see what all the excitement is about, Click Here!
Until next time,
Grayson Roze
VP of Operations, StockCharts.com
Chart on, my friends.
Grayson Roze
- Director of Operations, StockCharts.com
- Author, Trading For Dummies (Wiley, 2023)
- Author, Tensile Trading: The 10 Essential Stages of Stock Market Mastery (Wiley, 2016)
- Co-Founder, StockMarketMastery.com
- Twitter: @GraysonRoze