I am rarely dramatic, but 2022 is an exception. I believe we are in the type of bear market that we haven't seen in a long, long time.
The pandemic-driven cyclical bear market in 2020 was a health care crisis, not a financial crisis. I wrote about it throughout the pandemic and boldly predicted in the middle of it that we remained in a secular (long-term) bull market. The 2020 bear market lasted 23 trading days. It was brutal, but it was swift.
The good news is that I very much believe that we remain in a secular bull market and we'll once again recover from this current cyclical bear market (yes, I believe it started in early January), though it likely won't be as quick as 2020. Our EarningsBeats.com members have been reminded over and over again for the past several weeks to expect exactly what we're seeing -- high volatility and cyclical bear market conditions. The whipsaws have been difficult, but we're just getting started. Many of you probably think, "well, how much lower can these stocks go?" The answer? A lot.
Holding at neckline support at 4300 on the S&P 500 and forming the right shoulder has been the "eye of the storm." It's given many a false sense of calm. When the next shoe drops, it won't be so calm. Volume will soar and retail traders will panic. Why? Because they always do.
The bad news is that this cyclical bear market won't be as quick as the 2020 version. 2020 was pure financial manipulation and no one will ever convince me otherwise. Gap downs and intraday buying on so many growth stocks. That provided great opportunities to make significant profits if you read what was happening timely and accurately. Those growth stock profit-taking days ended in 2021, with rotation away from growth stocks as inflation surged. I see inflation peaking over the next 2-3 months. The problem right now, though, isn't inflation; it's the Federal Reserve ready to ramp up interest rates to fight the ghost of inflation. By the time the Fed realizes they don't need to hike rates any further, the damage will be done and all the talk will shift to the "R" word -- recession.
Growth stocks will flourish. Just after the stock market has been pummeled and the shift towards a more accommodative Fed takes place, the next recession will be talked about over and over and over. But with inflation dropping and the potential of interest rate decreases on the horizon, growth stocks will suddenly surge. I hope you're ready. I know I will be.
We have to endure more pain first, however. This pain will help to reset sentiment, which has been ridiculously bullish the past two years. During our Market Vision 2022 event on January 8, 2022, I provided a sentiment chart that needed to be corrected. It was the CBOE equity-only put call ratio ($CPCE). The 253-day moving average, while it would seem to be a lagging indicator, actually is an extremely solid predictor of investor behavior and market performance ahead. Before we look at the 253-day moving average, let's start with a reprint of a CPCE chart that I provided here in ChartWatchers a month or so ago:
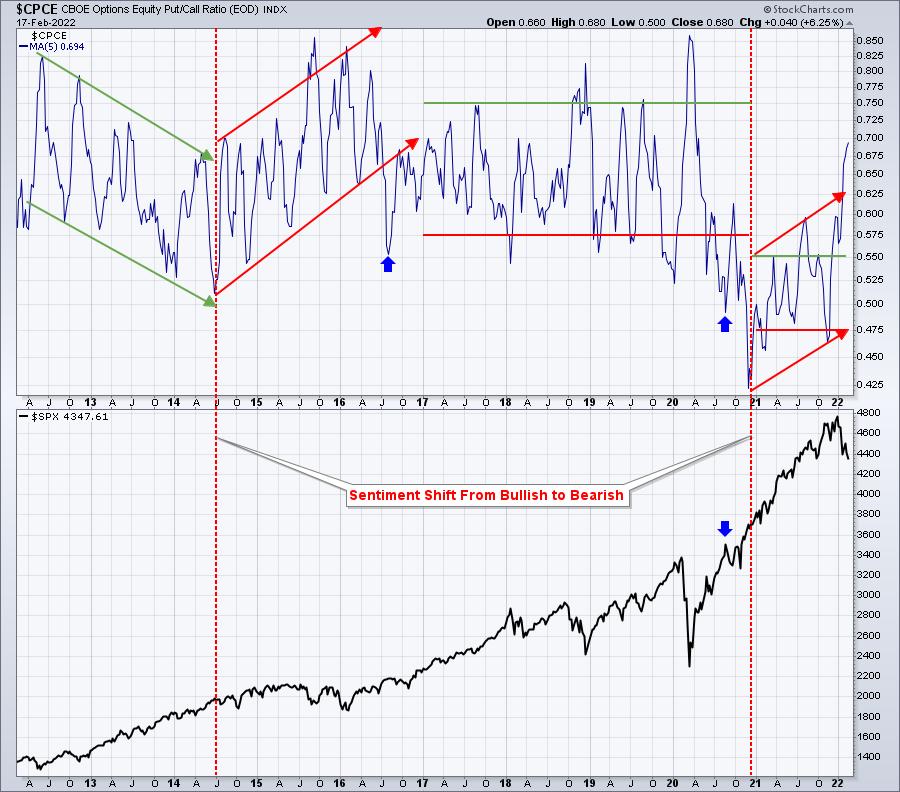
This is a "short-term" reset of the CPCE ratio. After the huge rally in the S&P 500 throughout 2013 and much of 2014, bullish sentiment reached a level that was simply too low. The market struggled for over a year and a half during the balance of 2014 and throughout 2015, while sentiment shifted. Once we reached a much higher 5-day moving average of the CPCE, the S&P 500 launched again. We've seen the market recently growing much more nervous as U.S. equities sell off. The rising 5-day moving average above clearly depicts the change in sentiment -- but only on a very short-term basis. This needs to continue for awhile....and it will.
We need that bearish sentiment to increase and to last awhile to carve out a meaningful bottom on the S&P 500, one where we can launch once again in this secular bull market. This is where the 253-day moving average comes into play:
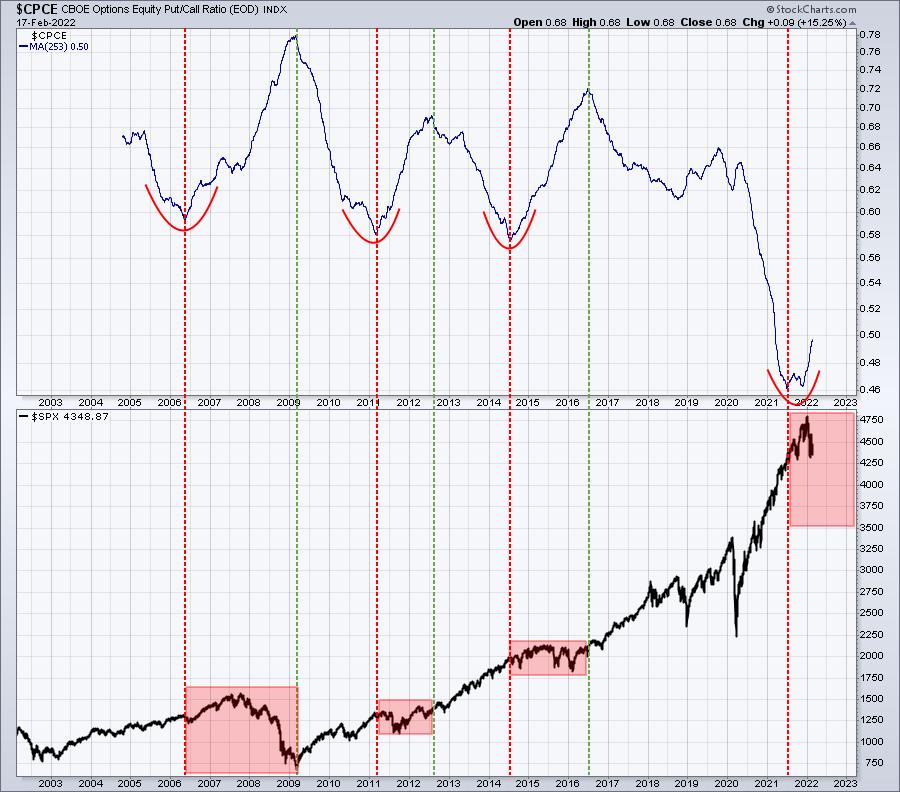
The red-dotted vertical lines mark warning signs where the CPCE reaches an extreme low (very bullish sentiment) and turns higher. Note that the S&P 500 struggled mightily after that. The green-dotted vertical lines essentially gives us that "all clear" signal when the CPCE has reached an extreme high (very bearish sentiment). Once everyone believes the stock market can go nowhere but lower, that's when we'll see another big advance. You have to get rid of the sellers.
I believe this 253-day moving average has a very solid track record. I see a minimum downside target of 3800 on the S&P 500, but would not be at all surprised to see 3500 and maybe even lower. And I'm convinced the breakdown of one chart will trigger it all. On Friday, this index finished 0.20% from a breakdown. If this index breaks down with the VIX nearing 30 (Friday's intraday high was 29.71), a subsequent surge in the VIX into the 30s or even the 40s could result in an absolute meltdown in our major indices.
Are you protected?
In Monday's EB Digest article (our free newsletter), I will share the chart and the bearish pattern that is on the verge of triggering. When its support is lost, I see another 500 points being shaved off the S&P 500 quickly. If you'd like to see this chart, you can CLICK HERE to subscribe to our newsletter. Again, it's free with no credit card required and you may unsubscribe at any time.
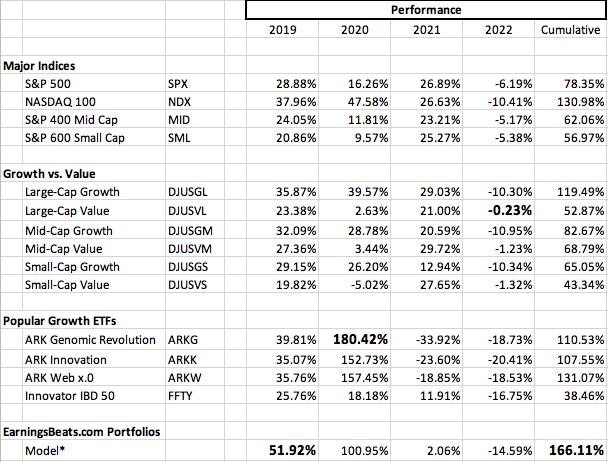
On Monday, February 21st (Presidents Day - Market Closed), I will announce the 10-equal weighted stocks that will be included in each of our portfolios. Below is a performance summary of several benchmarks, key growth and value indices, popular growth ETFs and our flagship Model Portfolio:
For more information on the event and how to reserve your seat, follow this LINK.
Have a great holiday weekend and happy trading!
Tom