 I do not believe that there is just one single tool, strategy, method, etc. that fits all our needs as investors or traders. For me, the power of research and analysis lies in combining information from various sources and subsequently putting all that together into a market-view, strategy, system, etc.
That is why I always encourage people to NOT use RRG as a standalone tool, but to always combine it with information from other sources and embedding their use into an investment process.
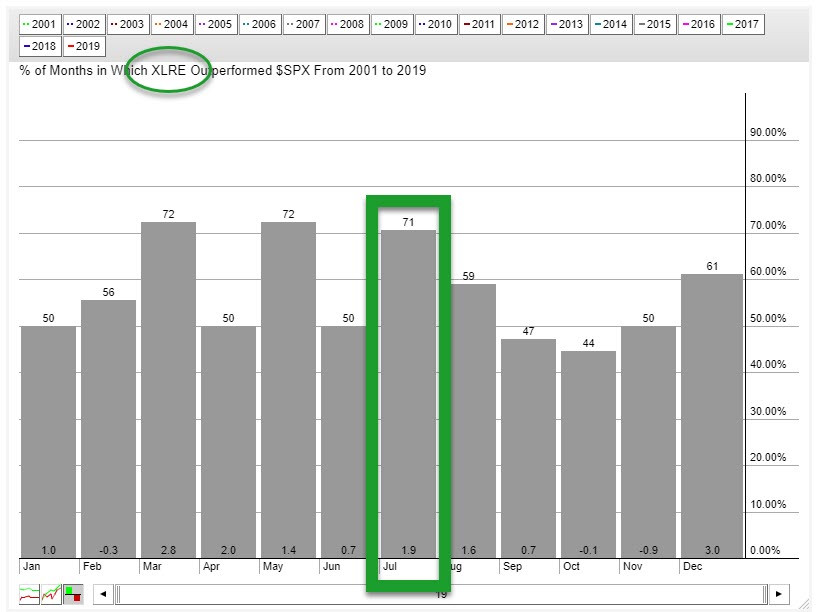
Today I was looking at seasonality charts that compared the performance of sectors to the performance of the S&P 500. What I noticed is that there is only ONE sector that shows an outperformance percentage for the month of July over 70% - the Real Estate sector.
XLRE outperformed the S&P 500 in 71% of the last 19 years, which is a pretty high number. For reference, the average outperformance comes in at 1.9%. When I look at the Relative Rotation Graph for US sectors below, I see the tail for XLRE rotating back into the leading quadrant following a stint through weakening.
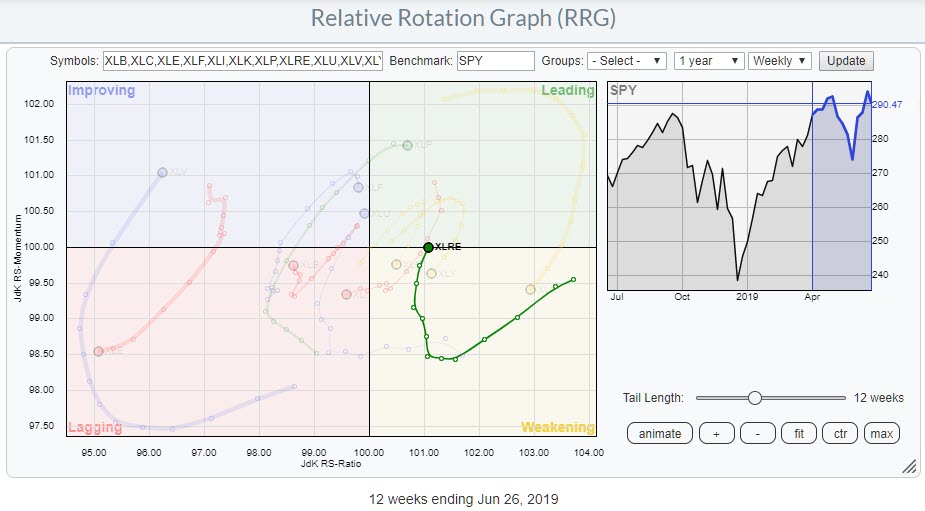 Real Estate entered the leading quadrant back in November 2018 and rotated further into it until February 2019, which is when it dropped into the weakening quadrant, gaining 5.8% while the S&P 500 showed a gain of 1.9%. From mid-February until the present, XLRE returned 5.3% while the S&P 500 picked up 5.7%.
A rotation back into the leading quadrant is usually a good sign, as it means the sector is gaining again on both the JdK RS-Ratio and the JdK RS-Momentum.
With the combination of a tail rotating (back) into leading from weakening AND a 71% outperformance in July, I believe things are looking good for Real Estate in the month to come.
My regular blog is the RRG Charts blog. If you would like to receive a notification when a new article is published there, simply "Subscribe" with your email address.
Julius de Kempenaer
Senior Technical Analyst, StockCharts.com
Creator, Relative Rotation Graphs
Founder, RRG Research
Want to stay up to date with the latest market insights from Julius?
– Follow @RRGResearch on Twitter
– Like RRG Research on Facebook
– Follow RRG Research on LinkedIn
– Subscribe to the RRG Charts blog on StockCharts
Feedback, comments or questions are welcome at Juliusdk@stockcharts.com. I cannot promise to respond to each and every message, but I will certainly read them and, where reasonably possible, use the feedback and comments or answer questions.
To discuss RRG with me on S.C.A.N., tag me using the handle Julius_RRG.
RRG, Relative Rotation Graphs, JdK RS-Ratio, and JdK RS-Momentum are registered trademarks of RRG Research.