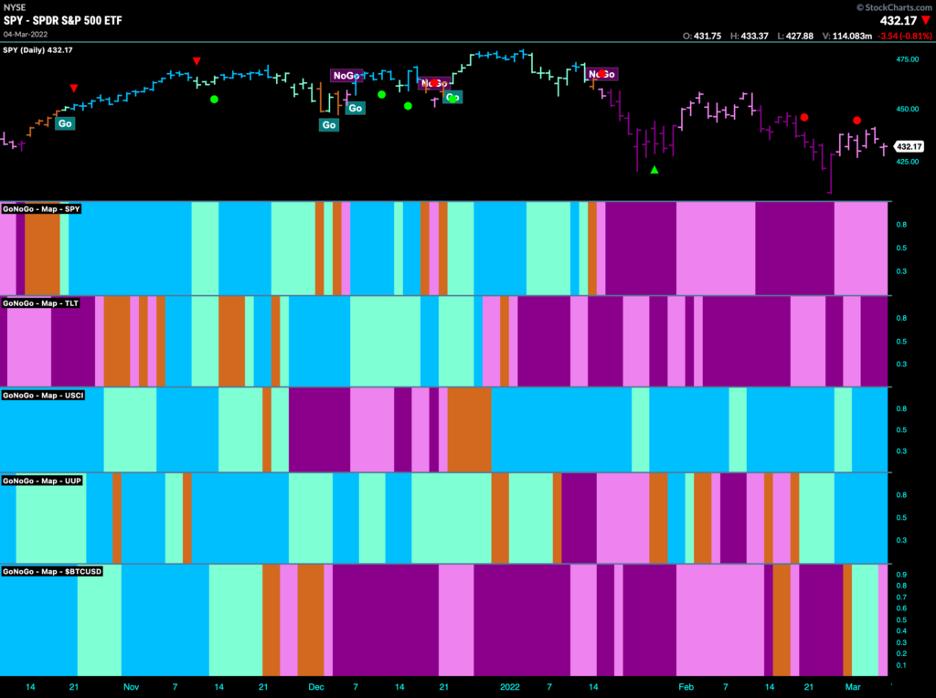
Good morning and welcome to this week's Flight Path, originally posted Monday, March 7th. Let's look at the below GoNoGo Asset Map for this week. The top panel shows that the trend in U.S. equities has remained a "NoGo", albeit painting paler pink bars this week. Volatility has continued as the world deals with continued unrest. Treasury bond prices remain in a strong "NoGo" painting purple bars. Commodities remain the leading light for trend followers as the "Go" trend remains in full force as oil prices continue to soar. The Dollar shows further strength this week and we saw Bitcoin roll over, unable to hold the "Go" trend from last week.
Sector Strength
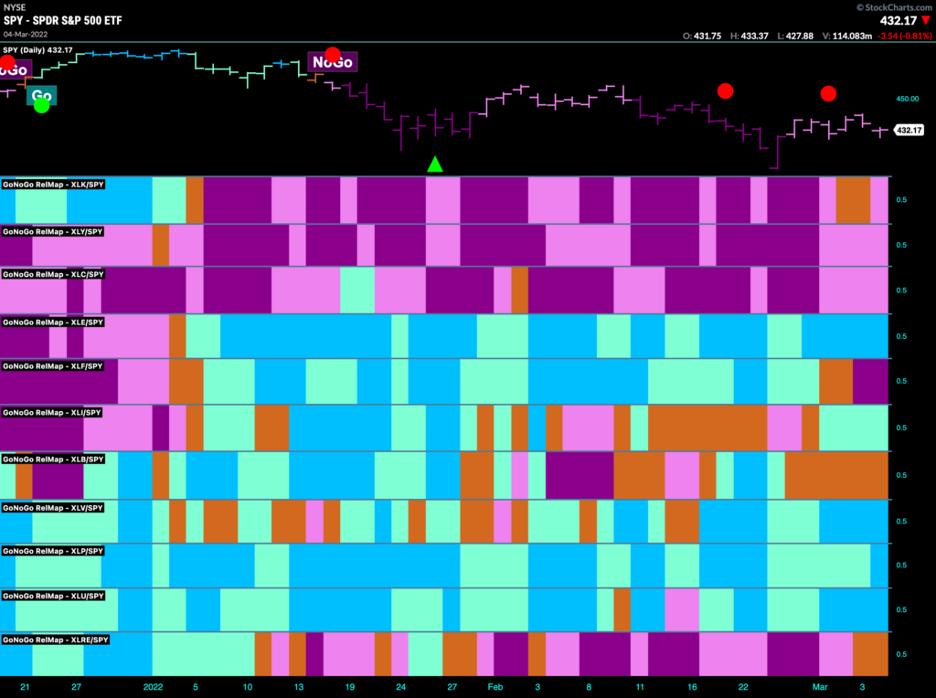
Below is a GoNoGo Sector RelMap. The chart applies the GoNoGo Trend to the relative ratio of each sector ETF to the base ETF, the $SPY. There are five sectors that are showing relative "Go" trends to end the week. Energy ($XLE) industrials ($XLI), healthcare ($XLV), staples ($XLP) and utilities ($XLU) are painting "Go" bars. The defensive sectors, therefore, continue to outperform on a relative basis, which is a sign of continued trouble for the markets. Technology ($XLK), discretionary ($XLY) and communications ($XLC) continue to drag the index lower as they ended the week lower. Financials ($XLF) fell into a strong relative "NoGo" this past week as uncertainty surrounds global banking systems.
Energy Finds Further Gains
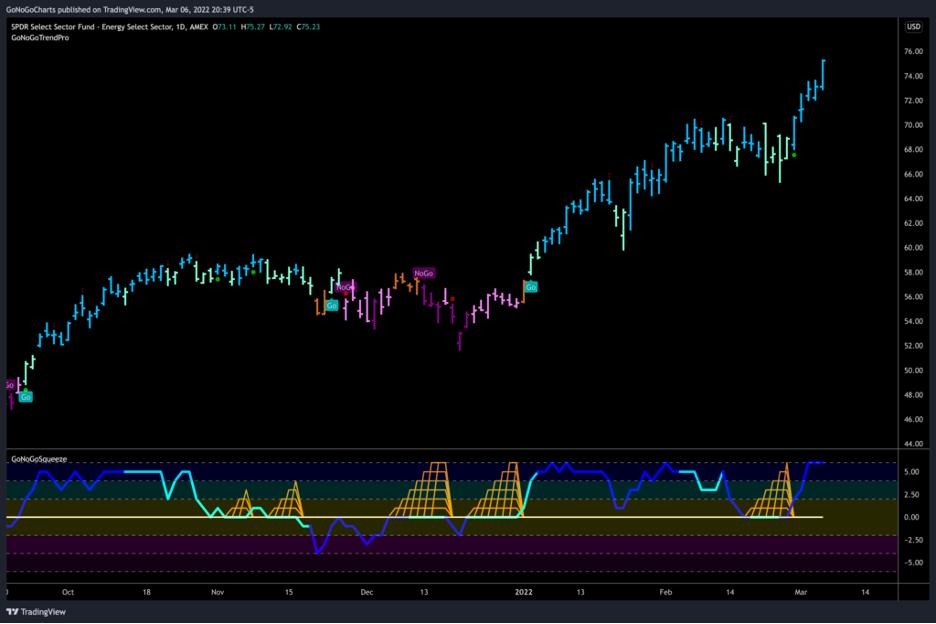
As the market continues to endure turmoil, the energy sector has been a provider of alpha for many investors. Last week saw another strong rise in prices, as we saw uninterrupted blue "Go" bars as price set higher highs daily. GoNoGo Oscillator rallied strongly off the zero line out of a GoNoGo Squeeze and on heavy volume. While the GoNoGo Oscillator is overbought currently, this is as bullish of a chart as it gets. We can look at any pullbacks as possible buying opportunities.
Oil in Demand
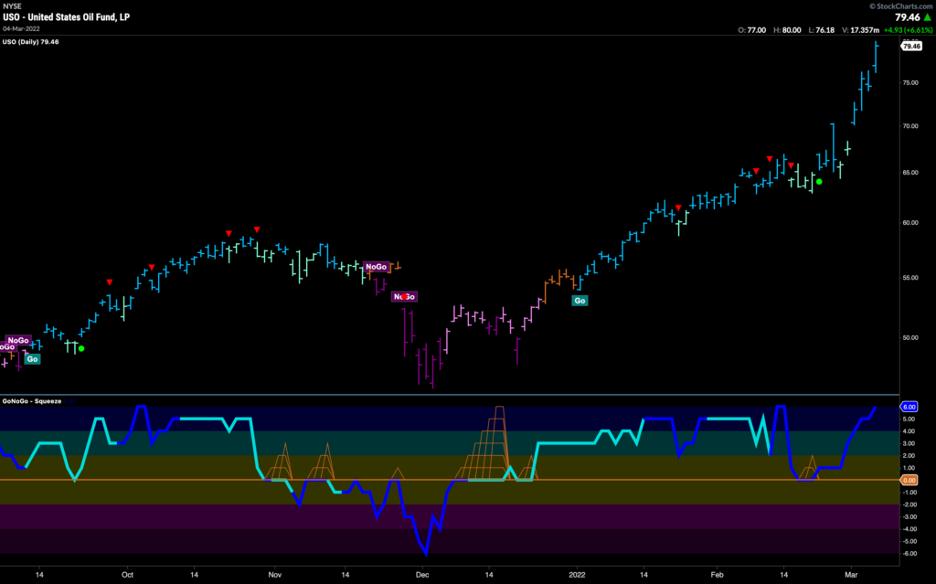
Of course, oil has been a primary driver in the strength of the energy sector and commodities in general. This week saw a rapid rise as tensions escalated in the Russia/Ukraine crisis. After the sideways price action in February, many wondered if the price of oil was overextended, but we saw a fresh Go Trend Continuation green circle as the GoNoGo Oscillator rallied sharply off the zero line on heavy volume. That consolidation proved to be a pause only in the "Go" trend.
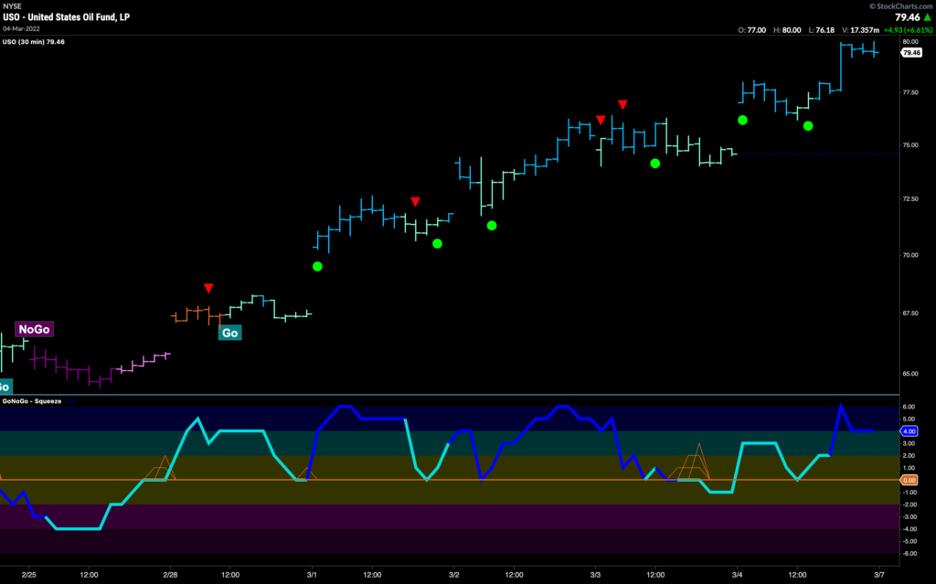
$USO Intraday for Entries
The daily chart of $USO above shows that price is overbought and at new highs. Is it too late to participate in this powerful trend? Are we resigned to sitting on the sidelines? We could spend the next few weeks watching the daily chart for a Go Trend Continuation icon or a pull back large enough to give us an opportunity to enter, but it may never come.
This is a situation where we can turn to multi-timeframe analysis. We can step down timeframes to find sensible entry points while, on the daily chart, price continues to run higher. The below chart is a 30-minute chart with GoNoGo Trend, Oscillator and Squeeze to illustrate the point. Price really took off after it gapped higher on March 1st and, on the daily chart, never looked back. Below, we can see that, when we go to a smaller timeframe, we get several opportunities to take part in the move. There are Go Trend Continuation Icons (green circles) every day from the 1st to the 4th on small pullbacks that weren't visible on the daily chart. This is the beauty of the fractal nature of technical analysis.
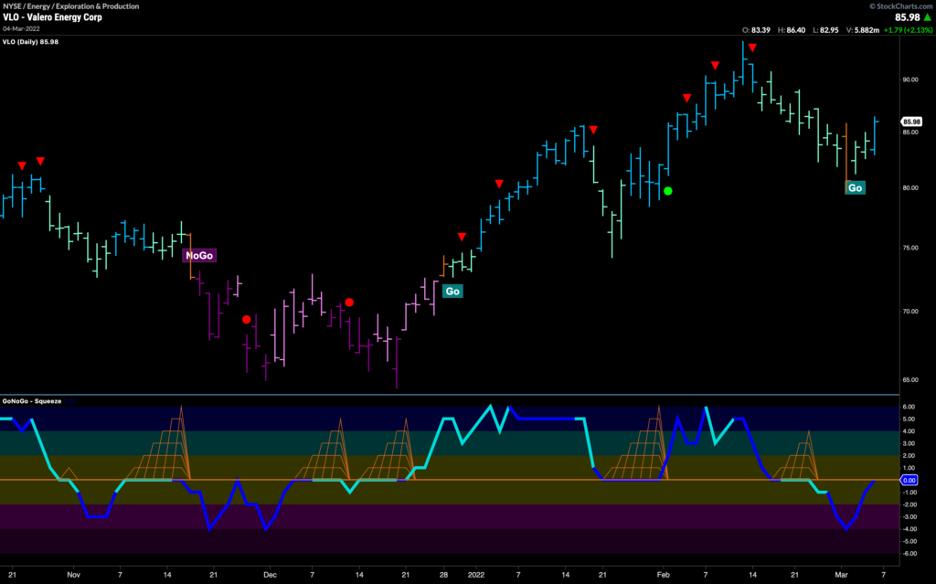
Valero Energy (VLO) Priming the Pump
As oil continues to move higher on a single-security basis, is there an opportunity to find? The chart below shows the GoNoGo Trend, Oscillator and Squeeze applied to daily prices of $VLO. We can see that while oil was racing higher, Valero saw a significant correction that culminated in an amber "Go Fish" bar with GoNoGo Oscillator well into negative territory. Price has rallied since, returning to "Go" bars, and the oscillator has risen to test the zero line. We will look at the oscillator here and, if it can break back into positive territory, we will see a Go Trend Continuation green circle under price, indicating that momentum is back on the side of the trend.
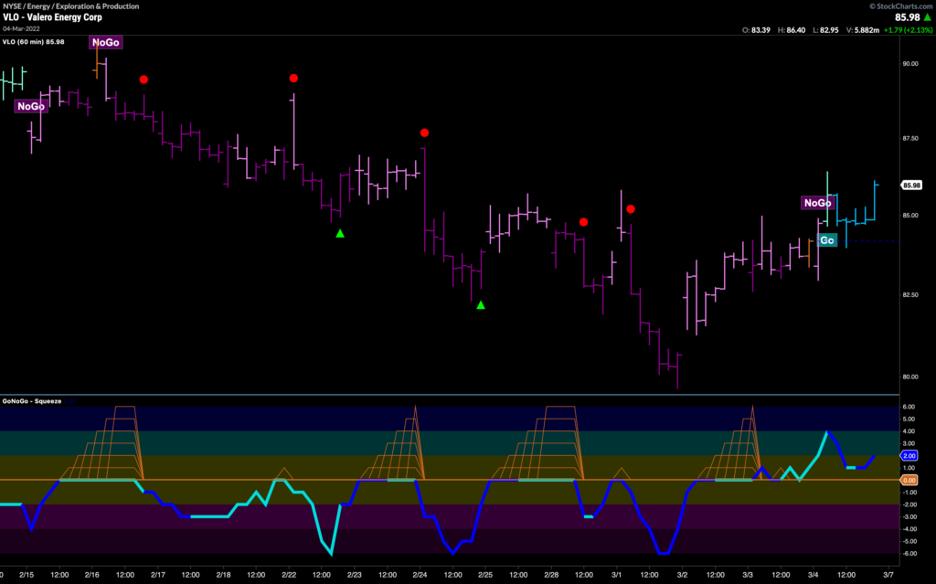
If we are looking to aggressively play the above scenario, we can turn to a smaller time frame, in this example a 60-minute chart. If our take is that strong oil will lift $VLO, then the 60 minute chart shows a new "Go" trend that began on Friday. The "NoGo" through the second half of February and into the beginning of March would have kept us away from the strong correction that we saw on the daily chart. The hourly trend is now a strong "Go" and we can potentially look for pullbacks on a smaller time frame such as this to get early exposure to a prolonged rally in Valero Energy should it come.
Better Charts. Better Decisions.
Alex Cole & Tyler Wood