|
|
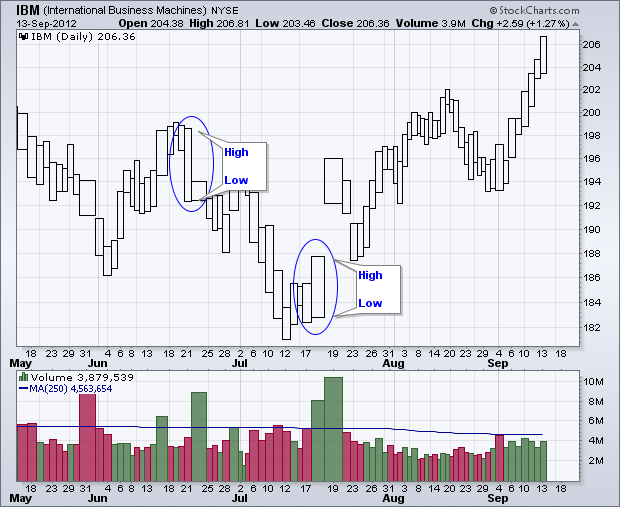
Both Equivolume and CandleVolume charts incorporate volume directly into the price plot. Volume is used to set the width of the boxes in Equivolume charts and the width for candlesticks in CandleVolume charts. There are, however, two main differences. The chart below shows IBM using Equivolume boxes. These boxes are always hollow and only show the high-low range. Equivolume charts are good for gauging volume, defining the overall trend and identifying chart patterns.


Click this image for a live chart.
The second chart shows CandleVolume charts. Notice that some of the candlestick bodies are filled, which means the close was below the open. The other candlestick bodies are hollow, which means the close was above the open. Also notice that candlesticks show the high and low as thin lines above the body. CandleVolume charts offer more detail on the intraday price changes and the relationship between the open, high, low and close.


