My Market Trend Model remains positive on all three time frames, which means I focus on three main goals: identify breakout opportunities with upside potential, lean into positive trends that continue to work and, lastly, look for signs of weakness that may indicate the bull market phase is exhausted.
On Friday's episode of The Final Bar, we talked about three stocks in the Communication Services sector that demonstrate where opportunities may lie in a sector that is struggling on a relative basis. I'll also share with you two other charts that I'll be following closely in the weeks to come!
Communication Services is one of the newest S&P sectors, formed a number of years ago from the old Telecom sector, along with internet names from Technology and media/entertainment stocks from Consumer Discretionary. As a result, this sector represents many different business models and, because of that, many different technical patterns.
We'll start with Alphabet (GOOG), with one of the most consistent uptrends around.
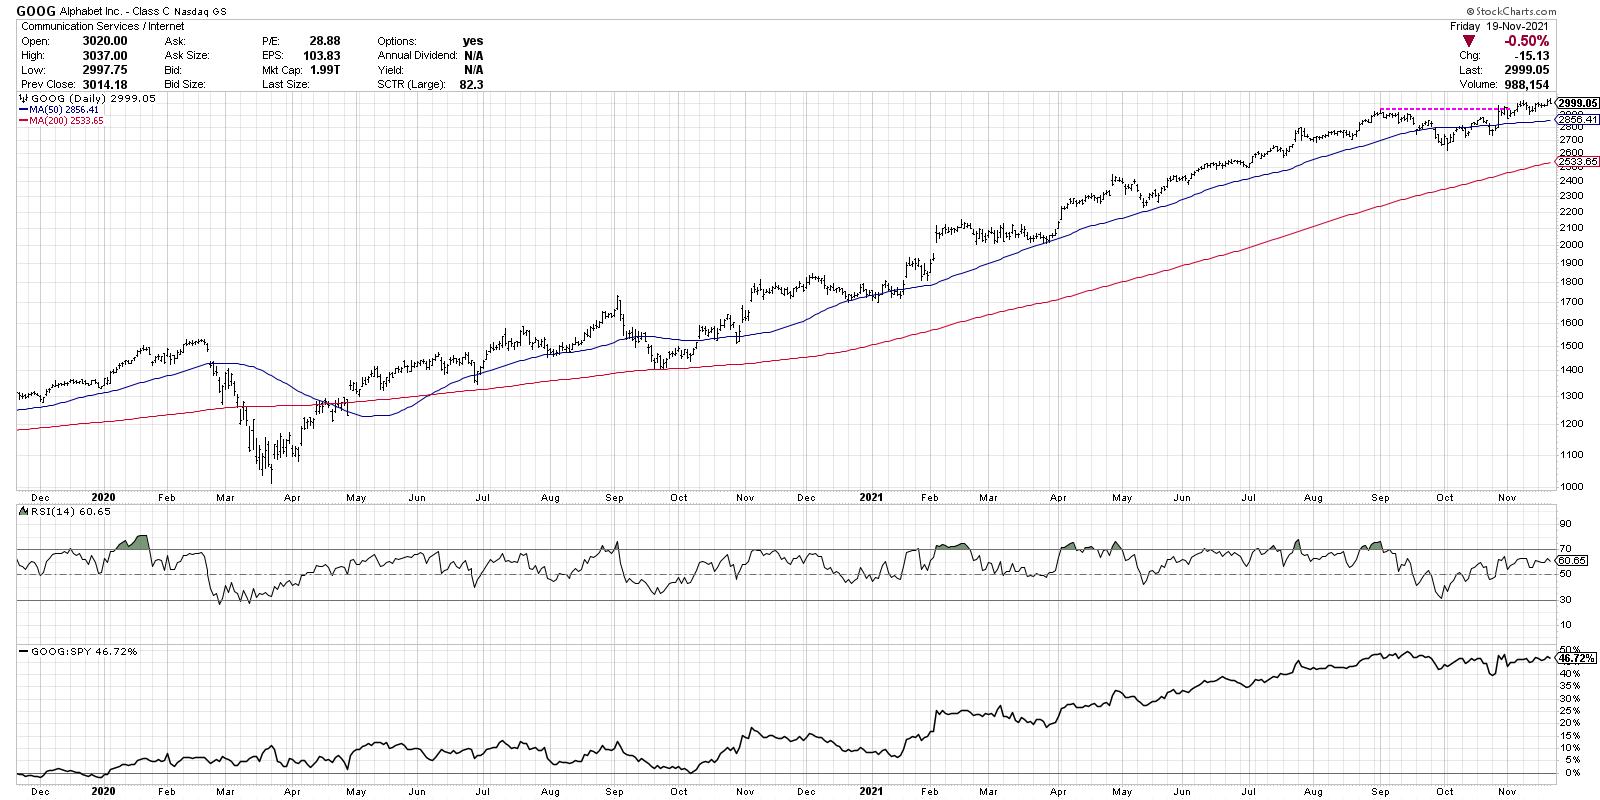
GOOG recently broke above the "big round number" of $3000, which took the stock above its early September price peak. If you look at the relative strength, you'll see the stock has essentially been in line with the market returns since that point.
This week saw interest rates pull back and the growth trade pushed higher, including names like Alphabet. I would expect a bullish trend like this one to remain in place until proven otherwise, but a break back below $3000 is what I'm watching using the StockCharts Price Alerts function.
Second, we have Meta Platforms (FB), which just rotated back above its 50-day moving average.
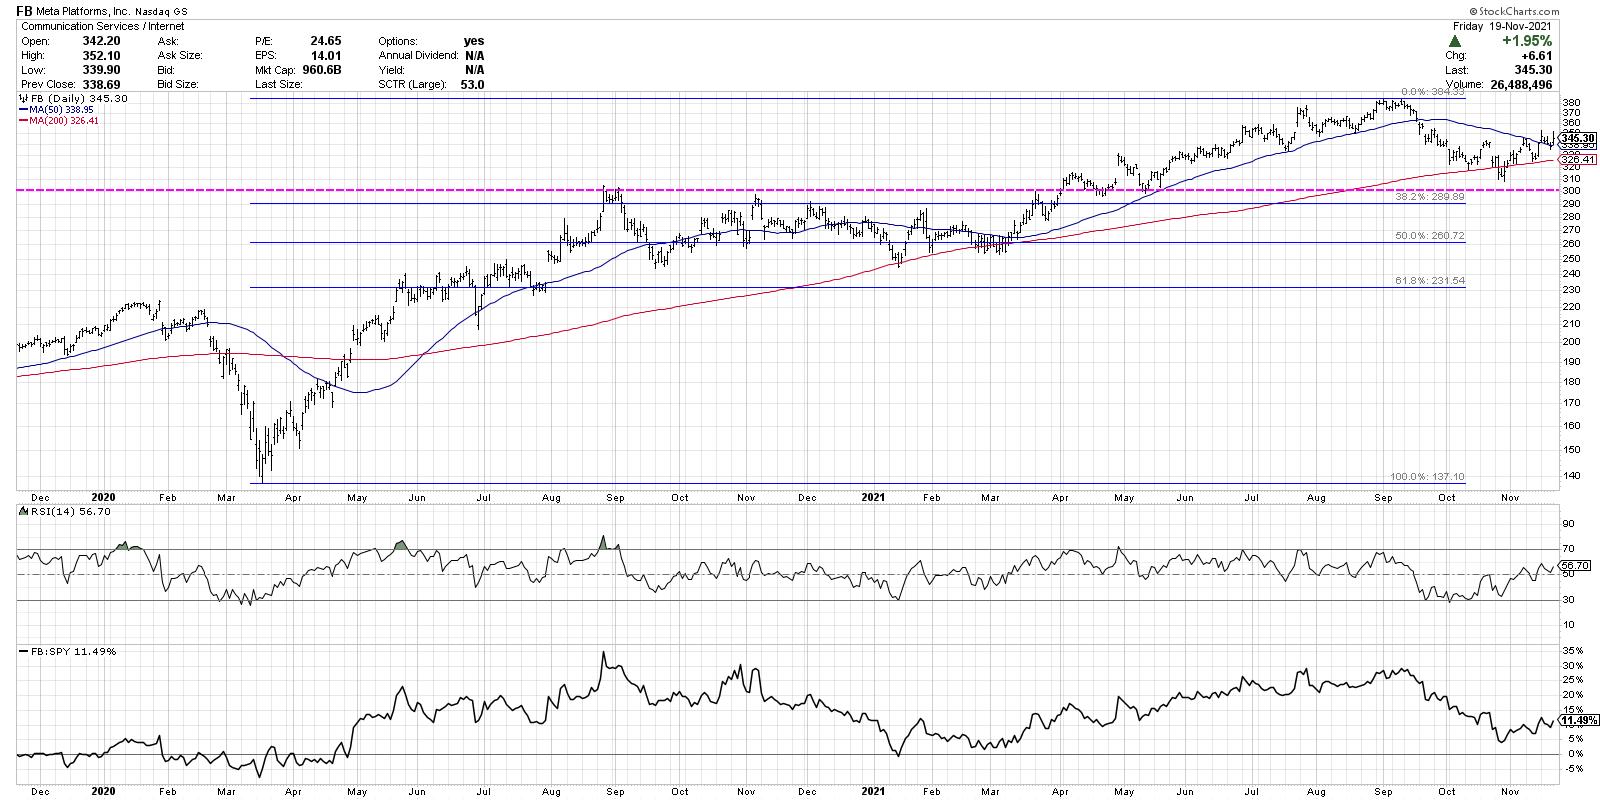
When FB started to pull back in early September, I keyed in on the $290-300 range based on previous support/resistance levels, as well as the Fibonacci retracement levels. While FB did violate its 200-day moving average, it remained above $300 and now has rotated back to a short-term uptrend. I'll remain focused on this important area of support because, assuming the price remains above $300, the uptrend appears to be intact.
Next, we have Walt Disney (DIS) and an example of a stock breaking price support.
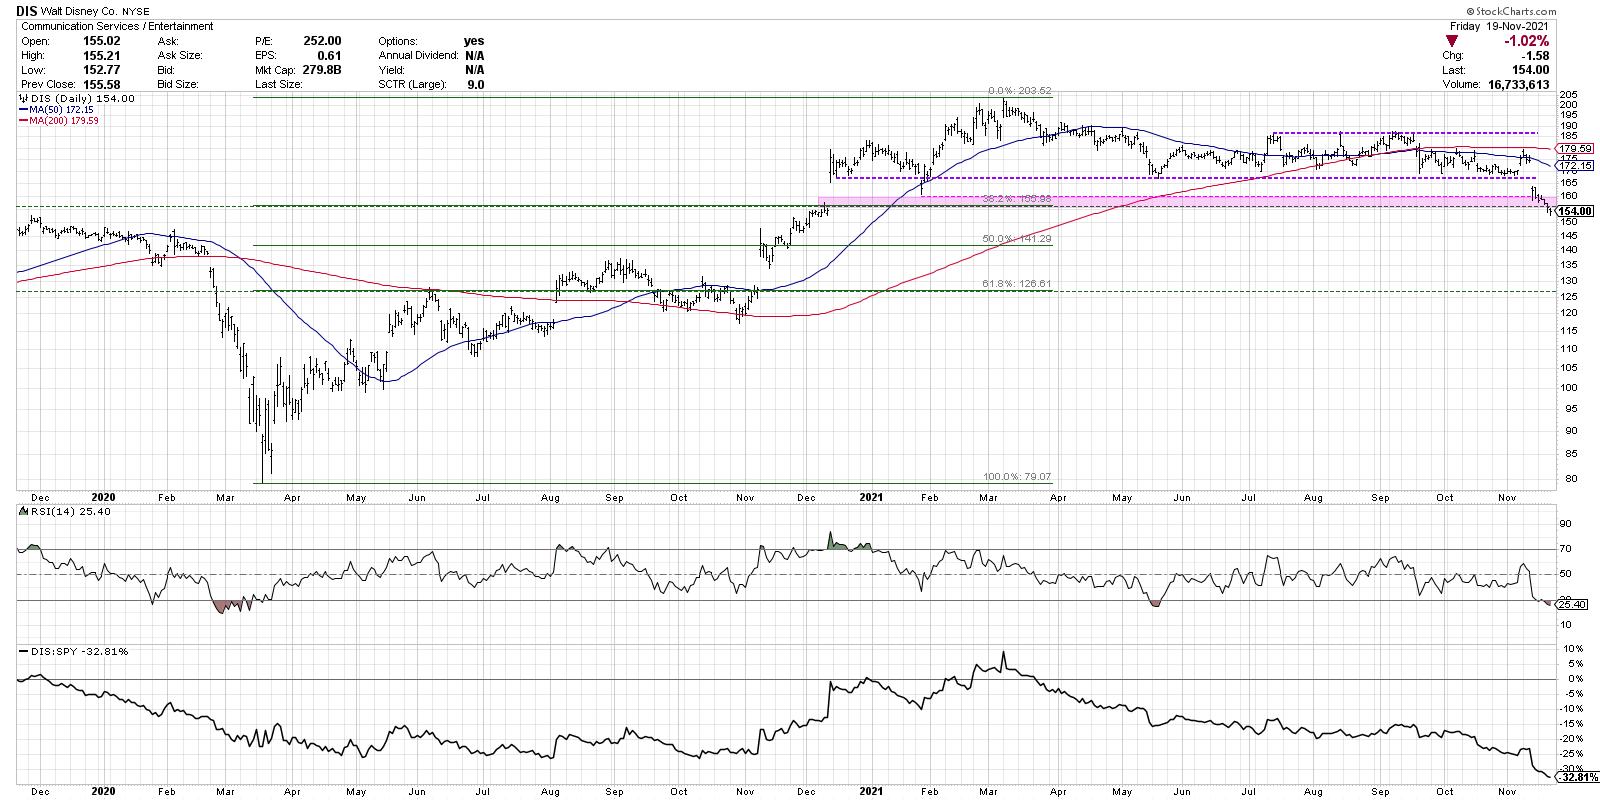
While FB has remained above price and Fibonacci support in recent weeks, DIS has done exactly the opposite. Now the chart of Disney has been less than ideal for quite some time; note how the stock topped out back March and has yet to regain those levels, compared to the consistent higher highs in our first two charts.
In the last two weeks, DIS has gapped down out of a six-month trading range, and this week followed through with a break of the 38.2% retracement level using the March 2020 low and March 2021 high. The stock has now reached the oversold region on the RSI for the first time since May. Back in May, the stock bounced off support, and I will be looking to see if there any signs of life for DIS going forward. For now, the overall technical picture appears negative with further downside potential.
Now we go outside of Communication Services for two stocks where Fibonacci retracements also are very much in play. Wynn Resorts (WYNN) is one of a number of gambling stocks that have shown signs of life in recent weeks.
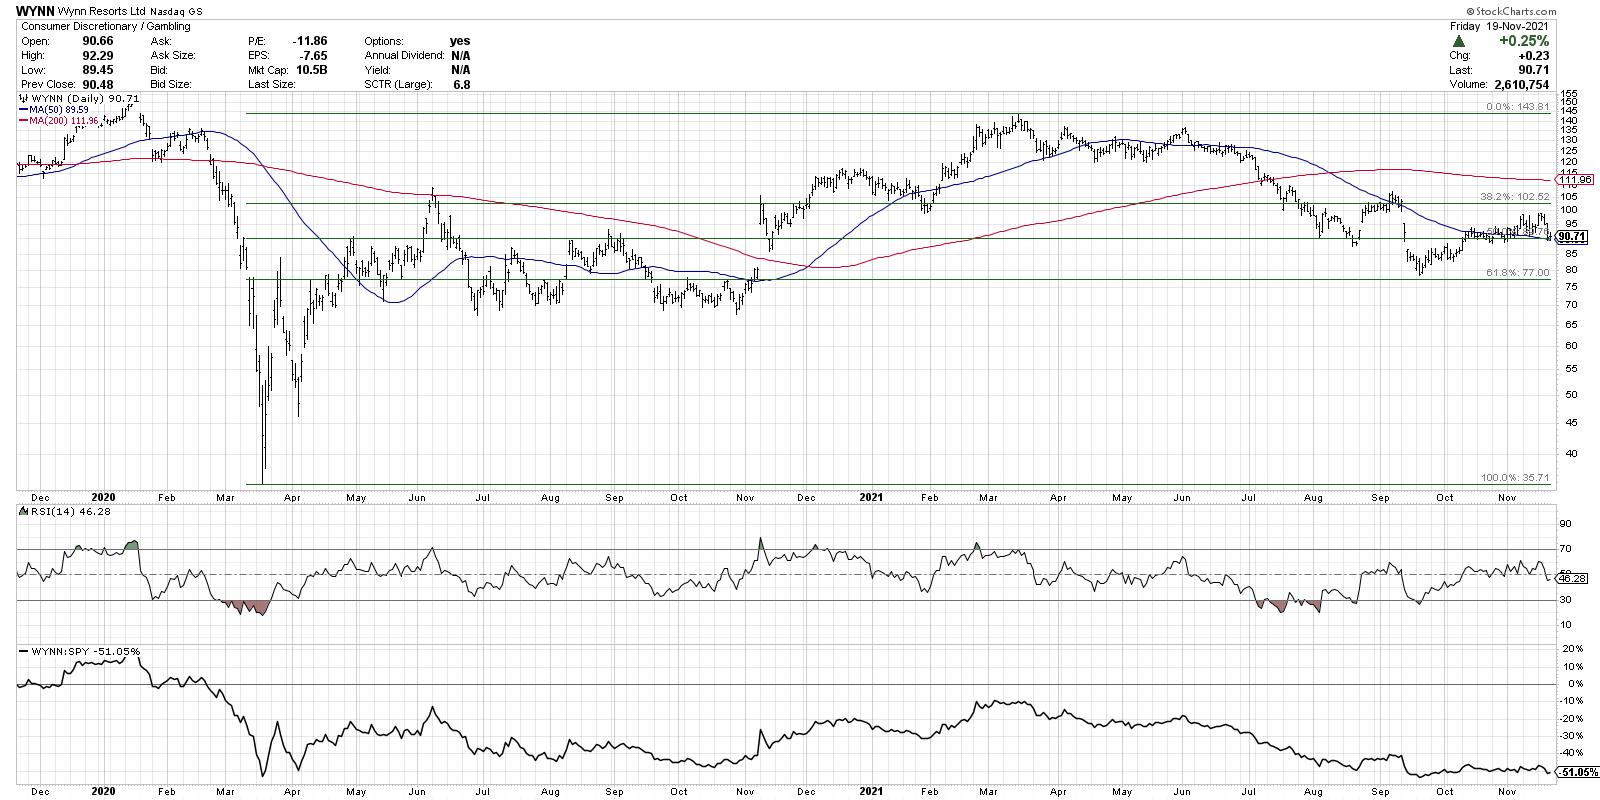
WYNN topped out in March, similar to DIS, but has seen a more consistent downtrend from that point on. After bottoming out near the 61.8% retracement level in mid-September, the stock has pushed higher over the past two months. Now the stock has moved back above its 50-day moving average, but appears to have stalled just below the 38.2% Fibonacci level. This is now a range-bound chart with clear resistance in the $100-105 level, and clear support around $77-80.
Which way will the price break? Given the fact that the RSI remains in the bearish range below 60, I'd give the benefit of the doubt to the bear case. But I'll be watching those key levels to see where the next breakout occurs.
Finally, let's look at Visa (V).
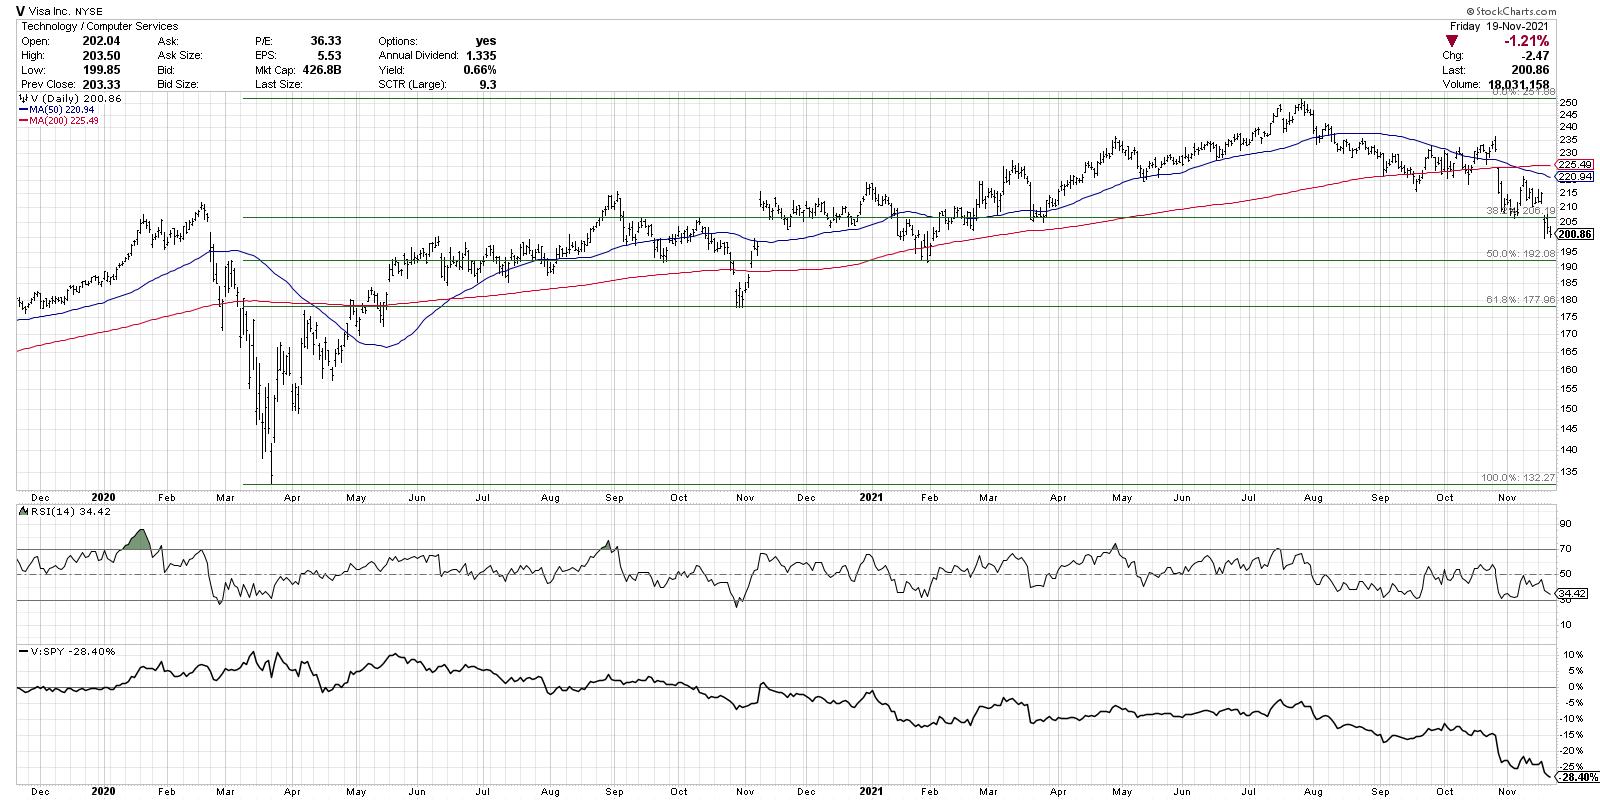
All of the payment processors, names like V, PYPL and GPN, have been struggling recently, while the broad markets have been moving higher. While charts like FB have found support before reaching their first Fibonacci objective, Visa has broken down through this key support level. V bounced briefly off the 38.2% level earlier this month, but this week's gap lower pushed the stock below $206 to the end the week right at "big round number" support at $200.
What's really compelling about the Visa chart is how well the Fibonacci levels line up with previous price support levels. The 38.2% level was hit a number of times earlier in 2021, the 50% level lines up with the Jan 2021 low, and the 38.2% is right at the October 2020 low.
Any time Fibonacci levels line up with traditional support and resistance levels, I've found these to be more meaningful and more important to track. For now, the path of least resistance appears lower, with next support around $192 and $178.
In a bull market phase, it's all about identifying opportunities for further upside. I've found that, by regularly reviewing key charts for important levels of interest, you can use price alerts to better anticipate inflection points and identify entries and exits.
If you want to get further information on applying Fibonacci Retracements on that last example, Visa, check out the video below!
RR#6,
Dave
P.S. Ready to upgrade your investment process? Check out my free course on behavioral investing!
David Keller, CMT
Chief Market Strategist
StockCharts.com
Disclaimer: This blog is for educational purposes only and should not be construed as financial advice. The ideas and strategies should never be used without first assessing your own personal and financial situation, or without consulting a financial professional.
The author does not have a position in mentioned securities at the time of publication. Any opinions expressed herein are solely those of the author, and do not in any way represent the views or opinions of any other person or entity.