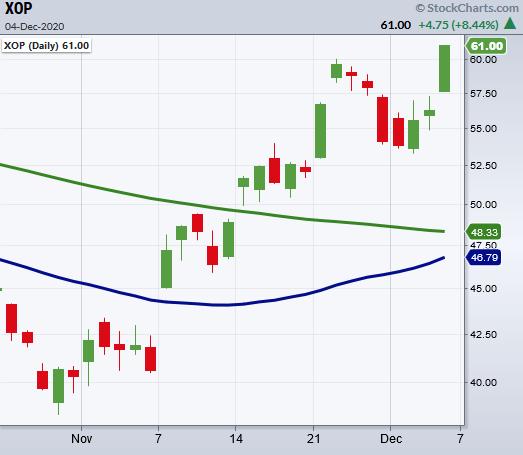
In the past couple of weeks, we've talked about the rise of oil and gas exploration (XOP).
On Friday, XOP closed with just under an 8% gain for the day. Its recent break over the 200-day moving average gave a good area to risk from. Even with its current price increase, this sector has suffered through a large downtrend for the last several years. On the monthly chart, XOP is not far from its low and looks to have a lot of upwards potential.
In other words, keep an eye on this sector. As long as it doesn't violate the 200- or 50-day moving average, it might be just getting started.
Friday ended on a strong note, with the S&P 500, Dow Jones, and Russell 200 all closing at record highs. XOP is rallying not only because it was heavily shorted and the market has turned to buying undervalued assets, but also because the assumption is that oil and gas demand will return with the hopes of more stimulus and a vaccine.
One other technical aspect of note is that XOP cleared the 50-week moving average this past week. This is the first close above that key MA since late 2018. Even with the popularity of electric vehicles and the bad press concerning the future of traditional oil and gas, with Denmark canceling all future licensing rounds for new oil and gas exploration, production and permits by 2050, the short-term signal is palpable.
Watch the latest episode of StockCharts TV's Mish's Market Minute, where Mish takes a dive into the Electricity Investment arena to see what stocks are moving and out-performing the market.
- S&P 500 (SPY): Record high
- Russell 2000 (IWM): Record highs with main support 180.30
- Dow (DIA): Record high. New support 300
- Nasdaq (QQQ): 298.73 support from the 10-DMA
- KRE (Regional Banks): 51.07 resistance. Support 47.22
- SMH (Semiconductors): Potentially sitting in overbought territory above bollinger band at 208.18 on a monthly chart
- IYT (Transportation): 225.49 resistance, 218.64 support
- IBB (Biotechnology): 145 area support with 148.01 resistance
- XRT (Retail): Closed all time highs.Support 59.24
Mish Schneider
MarketGauge.com
Director of Trading Research and Education
Forrest Crist-Ruiz
MarketGauge.com
Assistant Director of Trading Research and Education