On Wednesday, the major indices along with key sectors held pivotal support areas.
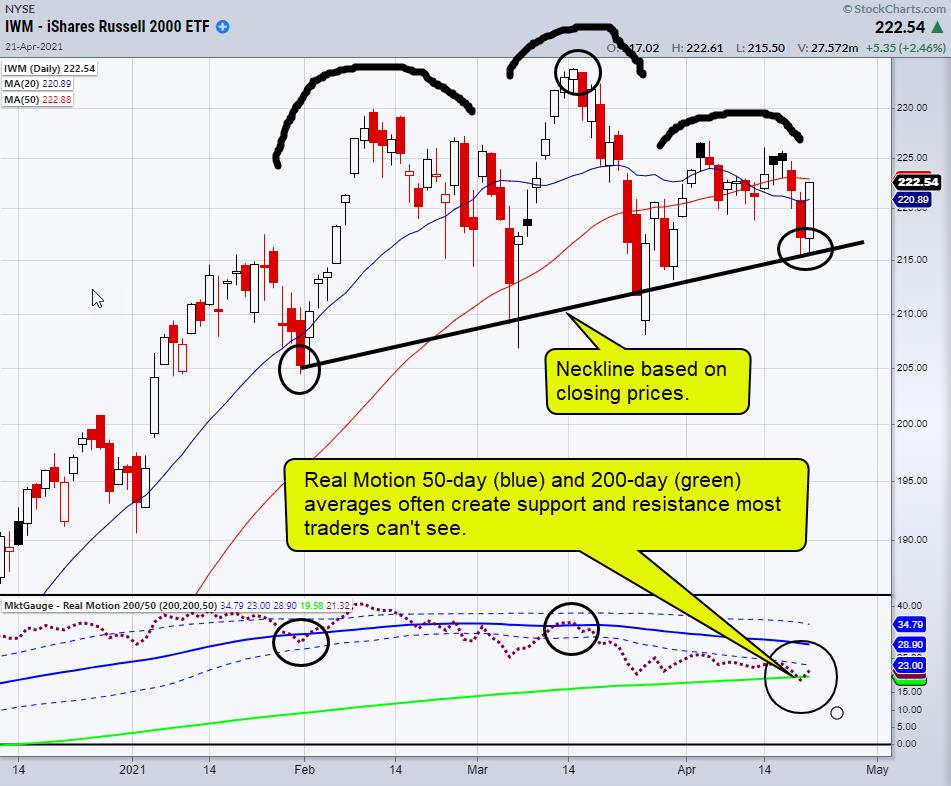
In the chart above, we can see that the small-cap index Russell 2000 (IWM) has put in some work to create a head-and-shoulders chart pattern. A head-and-shoulder pattern has 3 peaks, with the outside two being close in height to each other. This pattern can help predict bullish or bearish trend reversals.
Luckily for the bulls, a not-so-obvious support area was held. By drawing a trend line from the start of the left shoulder across closed candles, a neckline is created.
Most traders tend to focus on trendlines that are based on the highs or lows of the bars, but trendlines that are based on closing prices are just as important. The neckline drawn above is based on closing prices, and it shows how important this technique can be and revealing otherwise hidden support levels!
Another influential hidden support level can be seen in MarketGauge's Real Motion indicator. Just like price action, Real Motion finds support and resistance at its 50- and 200-day averages and, as a result, the price action reverses.
The circles on the chart above shows several examples of Real Motion support and resistance, identifying turning points that would be unexpected by looking at the price action alone. Real Motion sitting on its 200-day average helps confirm that IWM's rally has support and that price and momentum agree with the move higher.
With that said, IWM was not the only one to hold over support. Other indices, along with key sectors, were also able to close above their relevant important moving averages. For instance, Transportation (IYT), Biotech (IBB), the S&P 500 (SPY) and the Nasdaq 100 (QQQ) all closed over their 10-DMAs ,with Semiconductors (SMH) able to hold its 50-DMA.
With so many sectors and indexes bouncing off of well-defined support levels, we have clear price levels that need to hold, as any break of these levels would not be a good sign for the market.
ETF Summary
- S&P 500 (SPY): Closed over the 10-DMA at 413.25
- Russell 2000 (IWM): Resistance 226
- Dow (DIA): Held over 338.73 the 10-DMA
- Nasdaq (QQQ): Back over the 10-DMA at 338.42
- KRE (Regional Banks): Closed right on 66.31 the 50-DMA
- SMH (Semiconductors): Held 242.45 the 50-DMA
- IYT (Transportation): Hovering around highs
- IBB (Biotechnology): 146 support. Resistance 155.29
Forrest Crist-Ruiz
MarketGauge.com
Assistant Director of Trading Research and Education