As the COVID-19 delta variant spreads across the United States, the CDC continues to update its guidelines to mitigate further spread. Although we don't know if there will be any nationwide lockdowns or reduced travel restrictions in the immediate future, it has become abundantly clear that COVID issues are not even close to over just yet.
The global pandemic has been a leading cause of stress on the market and could delay the "back to normal" trend that so many people have been focused on. With that said, Tuesday's price action confirmed a reversal top in two of the major indices. If fear continues to grow in the market and the reversals in key indices turn into larger pullbacks... what price support levels should we hope to hold in the coming weeks?
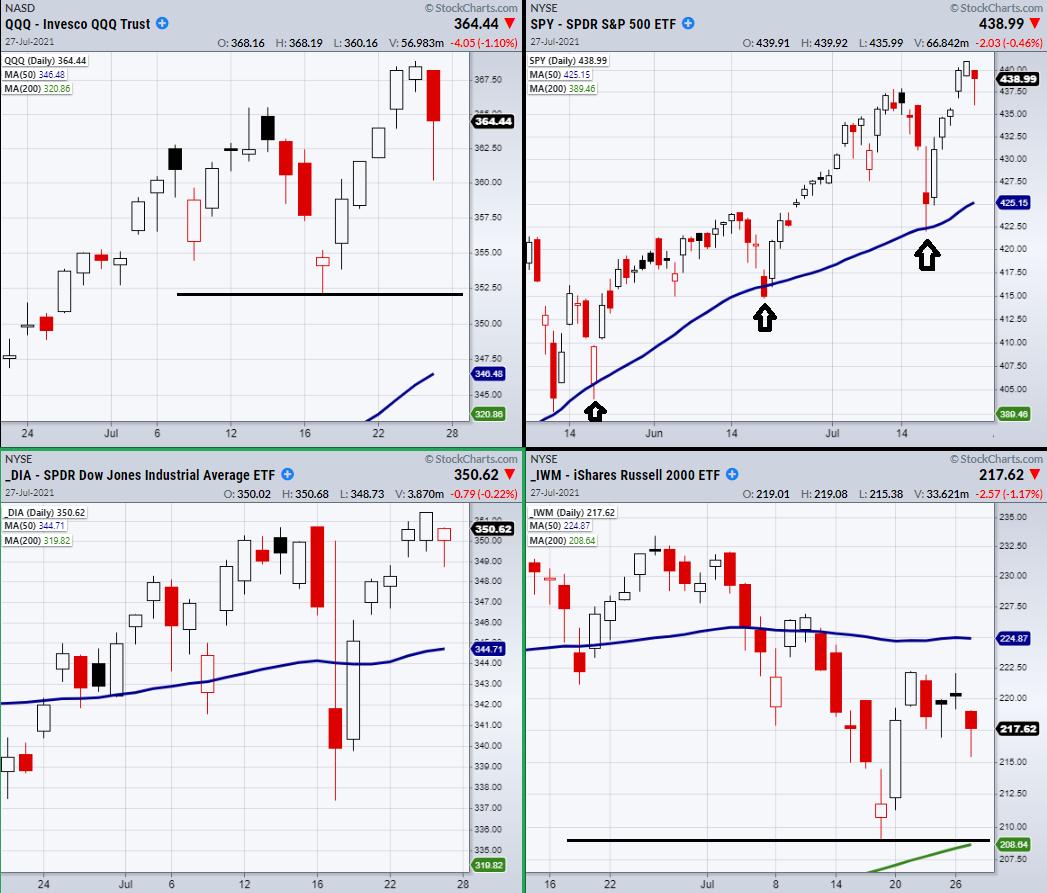
Looking at the 4 major indices, both the S&P 500 (SPY) and the Nasdaq 100 (QQQ) broke underneath their previous day's low. This confirmed the reversal pattern for both the SPY and QQQ. On the other hand, the Dow Jones (DIA) did not confirm a reversal pattern, as it closed over Monday's low.
Additionally, the Small-Cap Russell 2000 (IWM) never made a reversal pattern; however, it does have clear support created from its recent low at $209.05. This is a very important price level because it also aligns with the highly watched 200-day moving average at $208.64.
When it comes to the SPY, the 50-DMA at $425 is its main support. The 50-DMA is a large support level because, if you look at the chart above, you can see how it has held this area through multiple times in a row.
Moving on to the Nasdaq, an easy level to watch in the QQQ is the recent low of 7/19 at $352. Although it is a minor support level, it is a clear chart point that needs to hold if the Nasdaq breaks any lower.
Follow Mish on Twitter @marketminute for stock picks and more. Follow Mish on Instagram (mishschneider) for daily morning videos. To see updated media clips, click here.
ETF Summary
- S&P 500 (SPY): 439.26 needs to clear.
- Russell 2000 (IWM): 208.64 main support.
- Dow (DIA): 351 resistance area.
- Nasdaq (QQQ): Closed over the 10-DMA at 362.13.
- KRE (Regional Banks): Holding downward trend. Needs to break the 10-DMA at 62.14 for 2 consecutive days.
- SMH (Semiconductors): Closed over the 50-DMA at 250.81.
- IYT (Transportation): 251.78 pivotal area.
- IBB (Biotechnology): 157.11 main support area.
- XRT (Retail): Watching to stay over the 50-DMA at 94.87.
Forrest Crist-Ruiz
MarketGauge.com
Assistant Director of Trading Research and Education