U.S. indices have gone nearly straight up since early October, are extremely overbought near-term, and have needed reason for a pause. They may have received their reason overnight with U.S. airstrikes in Iraq. I refrain from political discussions because it honestly is not necessary nor productive. As technicians, we follow the charts, not the news. But what the market loathes more than anything else is uncertainty. We've watched the market ignore just about every piece of negative news the past three months as the Volatility Index ($VIX) has fallen from 21+ to just 12.47 at yesterday's close. The uncertainty button was pushed last night, so now we need to review the short-term action to at least acknowledge the short-term levels of support that could be tested. Here's an hourly chart to do just that:
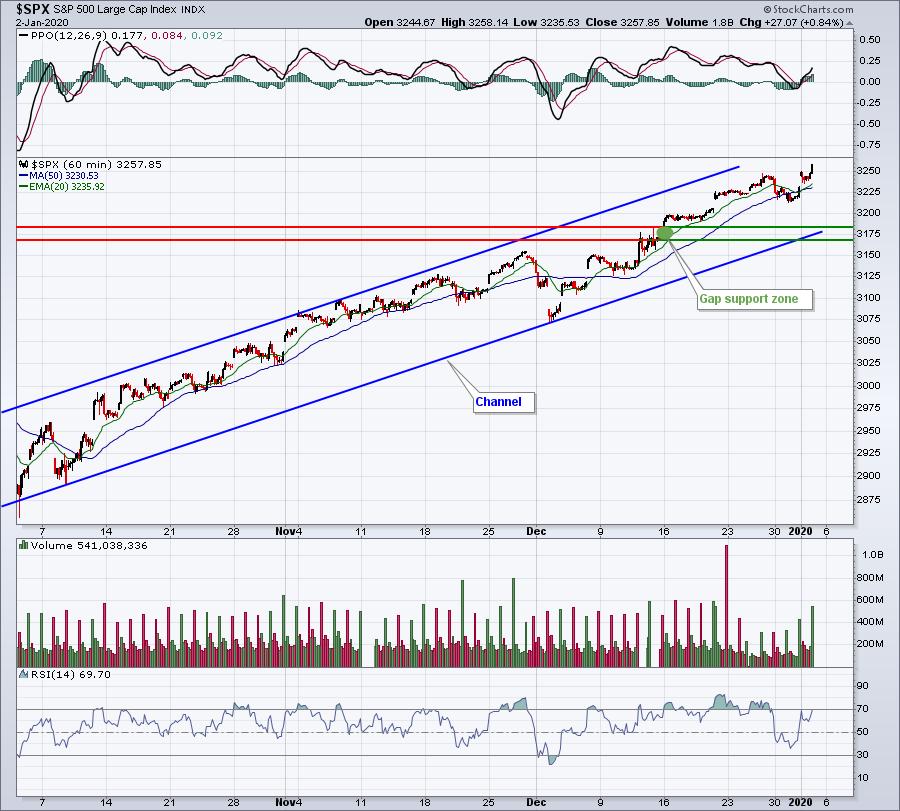
This was the chart that I included for EarningsBeats.com members yesterday. Even though I remain extremely bullish - adamantly so despite all the uncertainties and volatility in 2019 - the market rarely goes straight up. We grow numb sometimes as the market barely reacts to negative news and we keep seeing all-time highs print day after day. Stay grounded. 2017 was a year where we saw almost zero pullbacks, not a single selloff of 3% or more. That was a record. That's not typical bull market behavior. Expect 3-5% pullbacks from time to time.
Looking at the S&P 500 channel above, I believe there's a reasonable chance of a 3% pullback. That would essentially test the price support lines provided. Slightly less than a 3% pullback would test the rising channel support line. For now, that's all I'm expecting. The rising 20 day EMA is currently at 3195, which falls above the support levels identified on the hourly chart above. Therefore, I wouldn't consider the need to re-evaluate my big picture view unless the 3165 area was violated. If that were to occur, it would be time to bring in the reinforcement - the weekly chart:
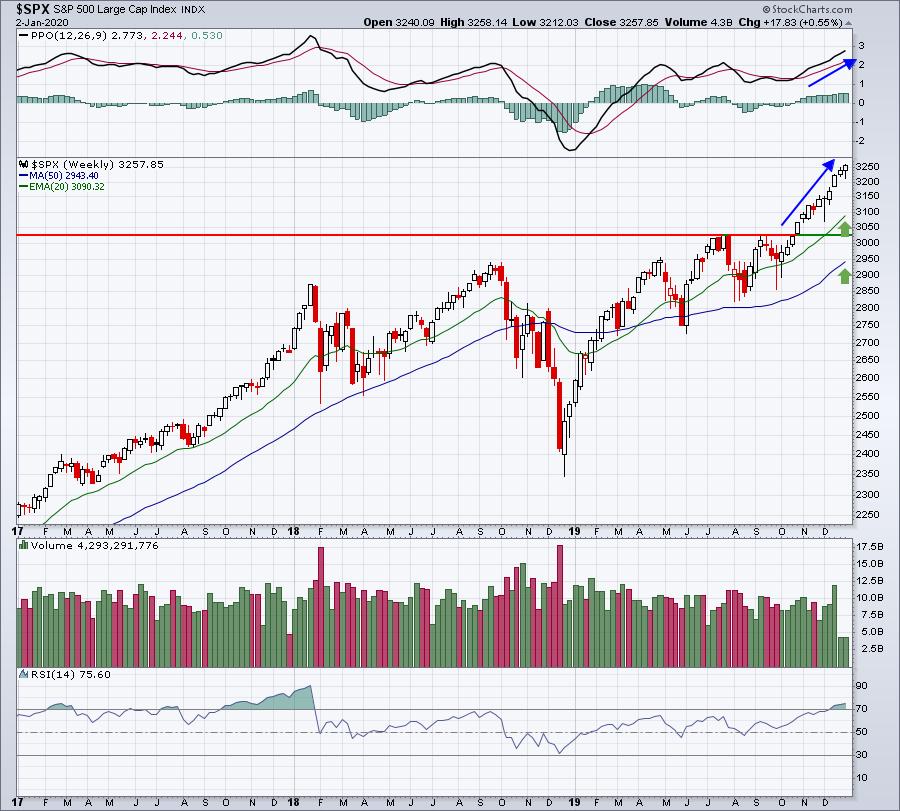
The 3 key levels of support longer-term are as follows:
- Rising 20 week EMA: 3090
- Price support: 3025 (double top breakout)
- Rising 50 week SMA: 2943
Should international tensions really heat up, I'd look for a bigger picture test of support. Honestly, I'll be surprised if we see a weekly close beneath the 20 week EMA, however.
I'll be monitoring this situation closely and providing my analysis every day for EarningsBeats.com members via my Daily Market Report. I provided it here over the holidays (I hope you enjoyed it!) and would love for you to join me at EarningsBeats.com. We're currently running a $0 special for trial monthly members. Subscribe for $7 and we'll refund $7. Net zero. No cost. No risk. CLICK HERE to start your 30-day trial today!
Happy trading!
Tom