On Tuesday, I held a special webinar for EarningsBeats.com members to discuss the massive amount of net in-the-money put premium on major ETFs and many individual stocks. I can't say with any certainty, but I believe the current strength likely won't last. We could see another day or two of it, especially given the unbelievably oversold conditions in the near-term, but every point that we move higher adds to the trading risk of holding on the long side with another bout of impulsive selling possible right around the corner.
Before we look at our current market condition, let's rewind back to 2008's panicked move lower and bounce to see what we might expect now:
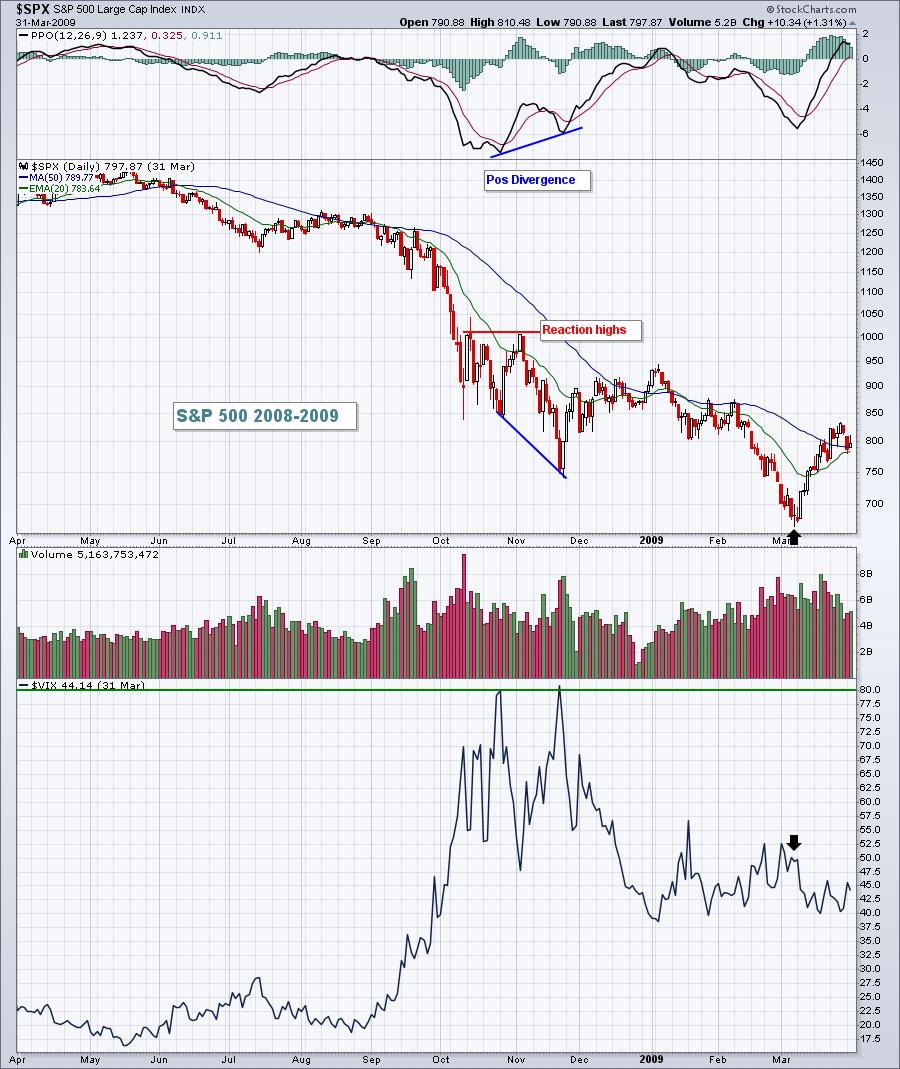
There were opportunities during the financial crisis, like the double bottoms with extreme pessimism, and the positive divergence in November 2008, but you really had to be patient to avoid the risk associated with crazy intraday and day-to-day price swings.
2020 isn't likely to be much different. We're definitely staring at more insane volatility ahead, so picking spots to trade will become very important. Here's our current chart:

Assuming Wednesday's low holds, a minimum Fibonacci 38.2 retracement rebound would be a near-term target. The news is not likely to improve over the next few weeks and we already know that much of the selling has taken place at the opening bell during March, with much less selling throughout the trading day. And the fact that the S&P 500 is so labored to move higher when so many March in-the-money puts are out there tells me a major rebound is probably not in the cards just yet, if it doesn't happen today.
One company that I discussed with members on Tuesday that could see an options-related bounce this week was Tesla (TSLA). Of all the companies I featured on Tuesday, TSLA had the highest amount of in-the-money put premium, net of in-the-money call premium, and that suggested we could see a rally. Check out TSLA's chart:
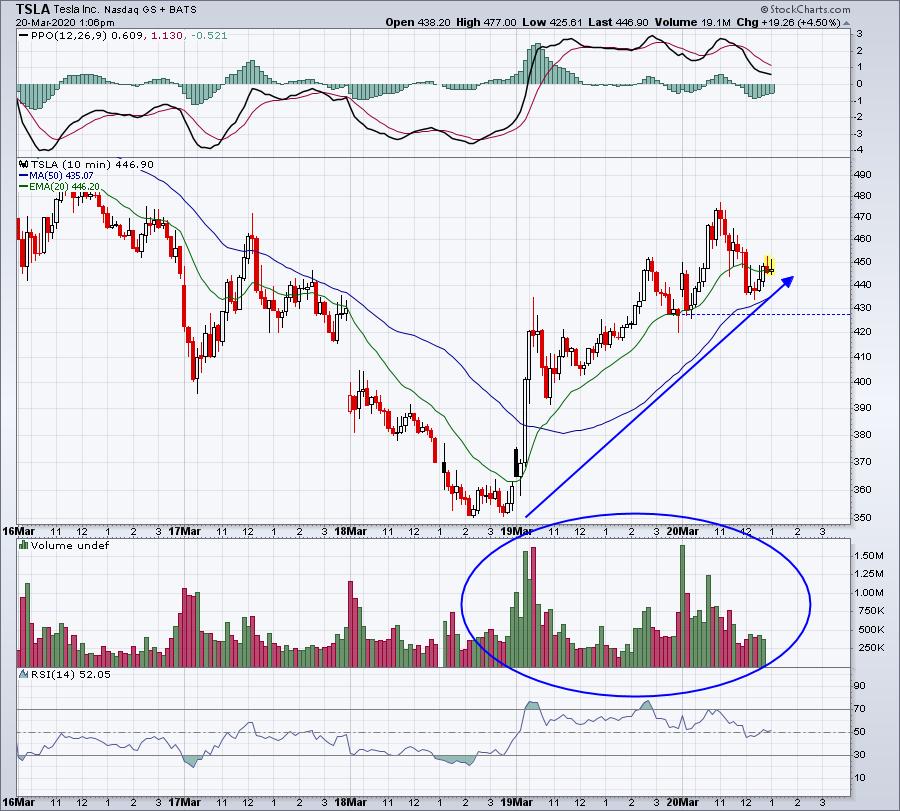
At its Wednesday low near 350, TSLA had net in-the-money put premium totaling more than $1.65 billion. The volume behind this buying has SOARED the past two days as market makers are likely driving the price higher temporarily to avoid losing tons on options. At today's earlier high of 477, that number had shrunk to almost ZERO!!! After this bounce, which might last a day or two, I believe we'll see TSLA fall back to at least print a double bottom.
If you'd like to receive the ChartList that I provided EarningsBeats.com members on Tuesday, just send an email to "tom@earningsbeats.com" and I'll send you the link and password. I annotated the charts with max pain levels (as of Monday's close) on the charts, so you can see how they've performed since. Keep in mind that many of these max pain levels have come down this week as more and more calls have been bought at much lower levels.
Send me that email with the subject line, "March Max Pain" and I'll send you the link and add you to our EB Digest newsletter - it's free!
Also, I know it's been a very difficult month for everyone, both in terms of health news and financial news. Accordingly, we're having a webinar tomorrow, Saturday, March 21st at 2pm EST, "Changing Strategies in a Changing Market: The Coronavirus Aftermath". Despite all the negativity right now, many tremendous opportunities will lie directly in front of us if we care to look for them, so this webinar will hopefully help to keep everyone upbeat about our future, while remaining aware of the short-term risks that we face.
CLICK HERE for more information and to register.
Happy trading!
Tom
Happy trading!
Tom