Trading isn't easy. It requires knowledge, experience, patience, discipline, risk management, preparation, research, and sometimes just old-fashioned good luck! After recognizing several cautious signals back in July, EarningsBeats.com suggested exercising patience to get us through whatever lied ahead. Well, hindsight now tells us that it was a correction. From high to low, here are how our major indices and sectors fared:
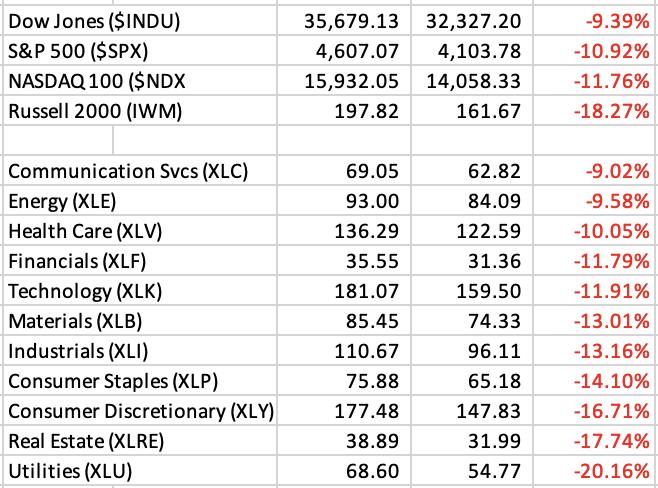
Look at where the relative weakness was found throughout this correction. 3 of the bottom 4 sectors were defensive groups - XLP, XLRE, XLU. These are "safety" sectors. One aggressive sector (XLC) outperformed all others. Two others - XLF and XLK - were "middle of the pack". This correction did NOT see a mass exodus away from aggressive stocks.
Before I go any further, let me show you the difference during the 2022 cyclical bear market. Here's how our major indices and sectors performed from the start of this bear market in early-January 2022 through late-February 2022:

Check out the bottom index and also the 3 bottom sectors. Doesn't that tell us a little different story? There was mass exodus OUT of key aggressive areas. Why? Because Wall Street had no interest in these groups and rotated away from them as the big firms saw further weakness ahead. That same message does not apply to this correction and that's one big reason why I kept saying we were going to see a very strong Q4 once this selling ended.
Could last week have sent a more powerful message? Here's how our 11 sectors performed during that massive buying spree:

So on the way down, the aggressive sectors held their own. But on the first significant rally, our 5 aggressive sectors - XLK, XLY, XLC, XLI, XLF - were all in the top 6 sectors. Only the ridiculously-oversold real estate sector beat these aggressive areas. Again, the story that this relative price action is telling us is that the prior selling episode was temporary is now OVER! It's just a matter of whether you prefer to listen to CNBC or the charts. I'll take the latter, thank you very much.
I wanted to give you the backdrop of the market environment the last 3 months - as I saw it. There are plenty of other signals I use to call likely market direction, but relative performance is a big one. Recently, I shared with members how difficult it's been for me to trade individual stocks since July. I haven't traded a lot, but when I have, it usually ended poorly. That changed in a big way this past week. I stuck mostly with ETFs tracking the major indices, but I re-introduced leveraged ETFs to take full advantage of last week's surge. Patience is key to maximizing returns and outperforming the benchmark S&P 500.
My best individual stock trade last week was easily NVIDIA Corp (NVDA). There were 2 important developments that created an absolutely awesome trading opportunity. The first one was the hammer candlestick that formed on Tuesday:

A hammer with an intraday breakdown below key price support is powerful. But perhaps even more powerful is NVDA's seasonality. As most of you probably know, I'm a stock market historian and am well aware of seasonal patterns on our major indices. Well recently, I decided to take it another step further and analyze key trends in many individual stocks. What I found was AMAZING! Perhaps the craziest stat I found on NVDA is that it LOVES its earnings months. That sets it apart from most large cap stocks, because most large companies report quarterly results in the first month of each calendar quarter. So the norm is to report during January, April, July, and October. But NVDA is different and reports during the second month of every calendar quarter. That means its earnings are released during February, May, August, and November (green-shaded areas above). Of all the individual stocks that I analyzed, NVDA had the strongest average annual return at 59.83%. That's amazing in itself, but listen to this. NVDA's annualized return for its 4 earnings months are its 4 best of the year. Check out these annualized returns:
- February: +82.25%
- May: +117.69%
- August: +80.31%
- November: +96.89%
Sounds like 4 pretty decent months to own NVDA historically. Knowing this information and then seeing that October 31st hammer at major price support and just before its historical November strength suggested an excellent time to enter this trade. So I entered. NVDA shot up nearly 50 bucks over the past three trading days. That's the potential power when you combine (1) a bullish technical setup with (2) a bullish seasonal period. There are also bullish tendencies for ALL stocks during the early part of calendar months.
Listen, EVERY SINGLE TRADER should know basic historical tendencies regarding the monthly calendar. It will help in your trading. You'll also find these trading patterns to be simply amazing! And many of you have been loyal supporters of mine and EarningsBeats.com over the many years that I've writing here at StockCharts.com. So I'd like to make you a one-time FREE offer to download "Bowley Trends Part 1: Long-Term Trends Since 1950". Keep it as a personal gift from me, a thank you for your readership here in Trading Places. CLICK HERE to immediately download your free copy!
Happy trading!
Tom