What's New
ALKI RELEASE | MARCH 2022
Spring has sprung here at StockCharts with a huge collection of dynamic new tools and features that just rolled out around the site as part of our "Alki" product release. We've put together some highlights down below to help you learn more about all that's included in our latest updates.
SCANNING
Set Your Scans To Run Automatically With "Scheduled Scans"
We've all got a few of our favorite scans - the ones we run consistently day after day, week after week. So to streamline your daily scanning workflow, we've introduced a convenient new Scheduled Scans feature.
You can now set any of your custom technical scans to run automatically at a specific time of your choosing, whether it's a particular market open, right after the close, or even a totally custom time of day. You can choose to save the results from those Scheduled Scans in a brand new ChartList, or drop them into an existing list from your account. Plus, when your Scheduled Scans run, you'll automatically get an email with a link to the day's results.
CHARTLISTS
Four New ChartList Views To Help Bring A Fresh Perspective To Your Analysis
For all you SharpCharts users out there, we've rolled out some powerful new features for your ChartLists.
- "Scroll" View: effortlessly scroll through an infinite feed of all the saved charts in your list without the need to flip from page to page.
- Enhanced "CandleGlance" View: all of the CandleGlance charts for your entire list will now appear on a single page. Additional charts will automatically load as you scroll down the page.
- "Symbol Summary" View: flip through a high-level summary view for each individual symbol in a ChartList, including technicals, fundamentals, earnings, dividends, corporate info and more.
- "Performance" View: compare price performance history for all the symbols in a ChartList, or compare them to a benchmark symbol to drill into relative strength and weakness across time periods.
CHARTLISTS
Nine New Data Options Added To "Summary" View For Your ChartLists
In addition to the four new ChartList views detailed above, we've also released a major expansion for our existing "Summary" view. The latest update brings nine new data options to the Summary table, including key technical and fundamental metrics for the symbols you're following.
- Market Cap
- 20-day EMA Value (and percent above/below the average)
- 50-day SMA Value (and percent above/below the average)
- 200-day SMA Value (and percent above/below the average)
- RSI (14)
- ATR (14)
- ADX (14)
- EPS
- P/E Ratio
ACP
"Earnings Dates" Chart Markers Help Make Sure You Never Miss A Report
Stay on top of upcoming reports for the stocks you're following and view past earnings dates right on your charts. New “Earnings Dates” markers can be enabled in a single click from the “Events” section of the ACP Chart Settings menu.
This new feature joins our existing chart markers for Dividends, Splits and Predefined Alerts. Plus, new position options allow you to display these helpful event indicators in four different locations on your ACP charts.
SCANS + ALERTS
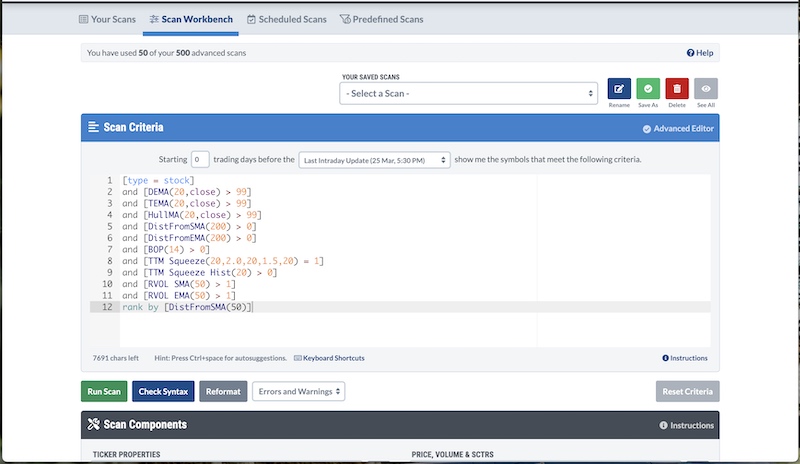
Create Custom Scans And Alerts For New Indicators In Our ACP Plug-Ins
Go beyond the charts by creating scans and alerts for the indicators included in two of our most popular ACP plug-ins for StockCharts Members: the “Advanced Indicator Pack” and the “RVOL Relative Volume Pack”. Screen over 50,000 symbols in our database with scan and alert support for:
- Double Exponential Moving Average (DEMA)
- Triple Exponential Moving Average (TEMA)
- Distance From Simple Moving Average
- Distance From Exponential Moving Average
- ConnorsRSI
- Hull Moving Average
- Balance of Power
- TTM Squeeze
- Relative Volume (RVOL)
And Those Are Just The Biggest Ones...
Other new features and improvements you'll see around StockCharts include:
-
✅ New "Alert Results" summary pages
Alert notifications now include a link to a results page with all of the symbols that match your custom criteria. Results are dated and timestamped so you can review past alerts for up to 60 days.
-
✅ A completely redesigned chart annotation experience in ACP
We've overhauled the annotations tools in ACP to provide a cleaner, clearer, easier-to-use experience. Selected annotations now include a full-featured settings panel for all the customization and style options, and new controls for popular tools like Fibonacci Retracements let you select your own Fib levels.
-
✅ Upgraded chart legends with indicator-matched color coding
Chart legends in ACP have a new look, including helpful border colors that make it easier to differentiate between multiple overlays like Moving Averages.
-
✅ Animated price changes in ACP
This new optional setting will show flashing background colors to indicate when prices change up or down during market hours.
-
✅ Run scans and create alerts for your ACP ChartLists
Our scanning and alert tools now include the ability to screen the symbols you've saved in an ACP ChartList.
-
✅ ACP ChartLists now included on "Your Dashboard"
Access all of your ACP ChartLists, create new lists and delete multiple ACP ChartLists at once, all from Your Dashboard.
-
✅ ACP speed improvements
You'll now enjoy faster chart loading and quicker data refreshes throughout ACP.
-
🐛 Bug fixes and stability enhancements
...and plenty of other behind-the-scenes improvements around the site.