BLOG ARTICLES WORTH READINGby Chip Anderson | ChartWatchers Hello Fellow ChartWatchers!
One of the more unexpected pieces of feedback that I've gotten as I have travelled around recently is that some people aren't reading our free Blog Articles because they associate blogs with rumor, innuendo, amateur writing, and lots of false information. While that might be true of some blogs, rest assured that the free articles that we publish here at StockCharts.com in our "Blogs" section are not like that at all.
1.) Our Blog Articles are only written by staff members or people we have a very close working relationship with.
2.) Our Blog Articles are focused on charting, market analysis or the StockCharts website.
3.) We moderate all comments that get sent in about our Blog Articles to insure that they stay on-topic and don't contain mis-leading information.
4.) There is an educational aspect to everyone of our Blog Articles.
5.) We only post Blog Articles when we have something useful to say.
6.) Many Blog Articles contain charts that are linked directly to our website so that you can click on the chart and see how it was created.
7.) We publish several blog articles each day - over 2000 so far!
8.) New blog articles are announced in the "What's New" area of our homepage, on Twitter, and in our RSS feed as soon as they are published.
We know from our web stats that many people are not reading our free Blog Articles. Please don't miss out on this very useful, free resource. Simply click on the "Blogs" tab at the top of any of our pages to get started. If you use an "RSS News Reader" program (more info), just point it to our RSS feed.
- Chip
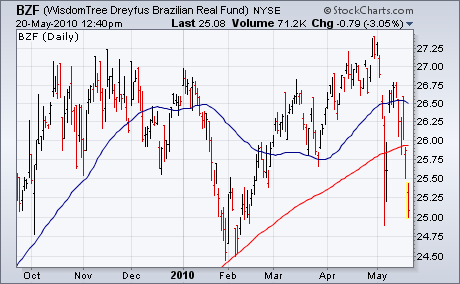
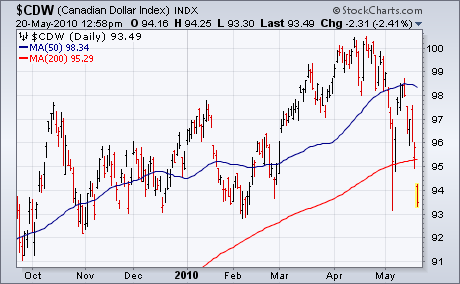
FOREIGN CURRENCIES TUMBLEby John Murphy | The Market Message In early April, I expressed the view that the rally in the U.S. Dollar
Index was coming mainly from weaker European currencies which meant
that the dollar rally wasn't as widespread as it appeared. To support
that view, I showed three foreign currencies that were rallying
strongly against the greenback that included the Australian and Canadian Dollars along with the Brazilian Real.
It didn't hurt that those three currencies were tied to
commodity-producing countries and showed that global traders were still
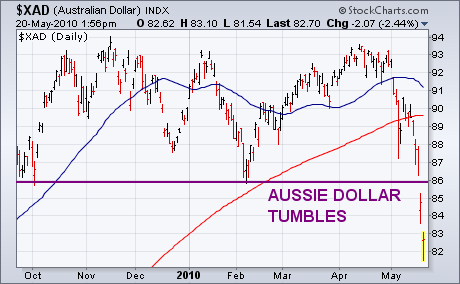
willing to assume some risk. That situation has changed. The next three
charts show all three currencies plunging below their 200-day moving
averages. The hardest hit by far is the Aussie Dollar.
Chart 3 shows that high-yielding currency plunging to the lowest level
in nine months. Money leaving high-yielding currencies usually flows
into lower-yielding ones like the Japanese yen in a flight to safety.
WHERE'S THE SELL SIGNAL?by Carl Swenlin | DecisionPoint.com
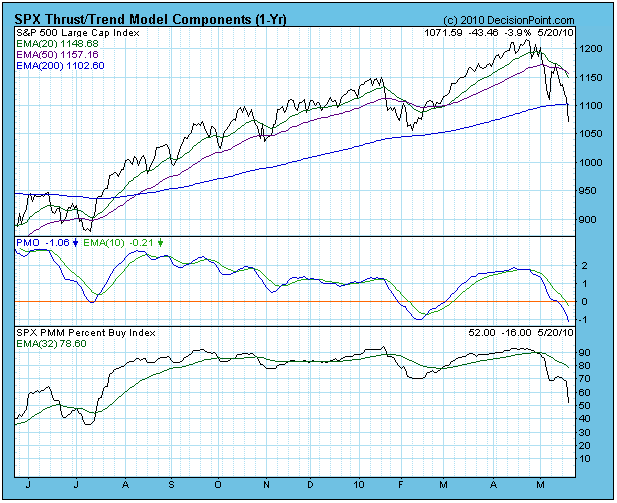
With the market in a dizzying decline, some of our subscribers are wondering
why our market posture is only neutral. Where's the sell signal? The
short answer is that the Thrust/Trend Model (T/TM) can only give a
intermediate-term neutral signal if the long-term signal is still on a
buy (the 50-EMA is above the 200-EMA).
This decision is based upon the conservative assumption that bull market
declines will be short-lived, and that a neutral signal eliminates
market exposure during a correction, while at the same time addressing
the lower probability outcome of a full bear market decline. In other
words, we never know if a bull market correction will actually be the
beginning of a new bear market, but we do know that most of the time it
won't be, so we bet with the odds and go neutral.
To answer the question of when a new sell signal will be generated: Not
for a very long time. First a long-term sell signal must be generated
(50-EMA crosses down through the 200-EMA), which, based upon the
current positions of the 50- and 200-EMAs, won't happen any time soon.
Once the LT sell signal is generated, we then have to wait for another
intermediate-term buy signal. After/if that IT buy signal fails, AND
the LT sell is still in effect, an intermediate-term sell signal will
then be generated.
The point is that we wait until LT conditions are negative, THEN we wait
for intermediate-term rules to generate a sell signal within the
negative long-term environment. Our foremost objective is to avoid
losing money during declines. Short selling losses can have a double
negative effect regarding our performance versus the market, so we try
to limit it to only those times where the odds favor success.
This doesn't prevent individuals developing techniques that allow them to be
more aggressive, but the parameters of the T/TM are intended to
function within an intermediate time frame, with the hope of filtering
out shorter-term swings.
Bottom
Line: There is no need to expect a signal change for at least a couple
of weeks. We think that the most likely next signal will be a new buy
signal, resulting from a rally that ends the correction; however, the
market needs to stop going down before it can go up.
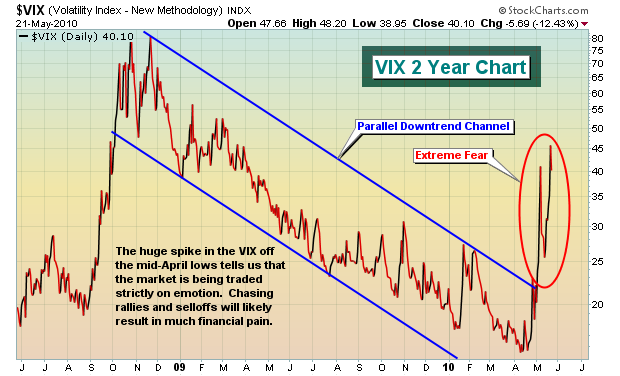
Many traders look at volatility and think huge potential rewards. I look at it and think huge potential risks. I know I'm conservative, but it's two different ways of viewing the same market. I concede that if you're on the right side of each extreme move, potential profits await - and big ones. But good luck being on the right side each time it moves. When the VIX rises as it's done the past two weeks, emotions rule the market. Fundamentals? Puh-lease! Hewlett Packard (HPQ) beat its quarterly EPS estimates, then raised guidance. It's reward? At the low on Friday, it was down 5% from its stellar earnings report, and that was on top of the 10% it was already down in May prior to that report. Congratulations HPQ, welcome to a fear-driven market. Volatility is routinely measured by the Volatility Index, or VIX. Check out the chart on the VIX and how it's risen dramatically off the mid-April lows:
Many who love the volatility and the possibility of big gains may also like trading the juiced ETFs. Let me just say be careful. I've done much research on these trading vehicles and produced educational videos on this subject. They are not long-term trades and holding on during extended periods in an extremely volatile period can be absolutely lethal. Let me give you a recent example. On April 27th, the Dow Jones US Financial Index (DJUSFN) closed at 288.21. On May 12th, the DJUSFN closed at 288.18. So 15 days later and nearly an identical close. The UYG (ultralong ETF that tracks the DJUSFN at a 200% clip) fell by nearly 1%. The SKF (ultrashort ETF that tracks the DJUSFN inversely at a 200% clip) fell nearly 2.5%. Losers were on both sides of this trade. This "slippage" occurred in just two weeks! Imagine holding these juiced ETFs for months, or even years! These are VERY short-term trading vehicles only. They are not designed to be held for longer than one day. The only time it will benefit you to hold for longer than one day is if you're on the right side of the trend and the trend continues without whipsaw volatility. In that case, the compounding nature of juiced ETFs actually increases your returns GREATER than the desired 200%.
Here's an example of what I'm talking about:
After that May 12th close on the DJUSFN of 288.18, financials tumbled for six straight days. The DJUSFN fell 11.20% during that period. If you were fortunate enough to be riding the SKF during those six days, you'd have made 25.14%. Given the 200% "expectation", the SKF should have gained 22.40% during that period. But it was the compounding of gains with juiced ETFs that actually exceeded the expectations of a doubling. That's why I always discuss trading these juiced ETFs only when the underlying index is at a key support or resistance level on the chart. If you catch a reversal, you can hold as long as the trend moves in your favor. But always remember that back-and-forth, volatile action cripples your performance. Thus, juiced ETFs should NEVER be considered a long-term holding. It's one of the few times I can say with certainty that you WILL lose your money if you hold long enough.
The extreme volatility is also creating problems for traders because of huge gaps in both directions at the opening bell. Knowledge of gap trading is very important. Most gaps are of the common gap variety, meaning they'll usually revert back to the prior close, "filling" the gap. But there are other types of gaps that must be recognized at the time of, or just after, the gap in orderly to appropriately trade and minimize risk. Last week, I held the second in our monthly Online Trader Series, "Learning to Trade Gaps with Precision". You can still access this video. Also, check out the exhaustion gap that we identified on Chipotle Mexican Grill (CMG) on our Chart of the Day from a week ago. CMG fell 13 dollars after we featured it. For more details on the CMG chart and on gap trading strategies, CLICK HERE.
Happy trading!
S&P 500 AT A CRITICAL JUNCTIONby Richard Rhodes | The Rhodes Report The S&P 500 decline over the past several weeks has reached a critical junction point in the decline at the 380-day exponential moving average support level. There are several forward scenarios that can occur:
1) Prices are sufficiently oversold on a short-term basis to where the S&P can manage to move to new highs above the 1217 level. This would represent a rally of +12% or thereabouts. The question would then become whether significant and material negative divergences developed in the advance/decline and new highs/new lows indicators that would suggest a major top in the making. This period would likely be akin to that of the August to October 2007 rally that led to the end of the cyclical bull market.
2) Prices are sufficiently oversold on a short-term basis to where the S&P can only manage a countertrend rally towards the 1130-to-1180 zone, and then fall back and breakdown below the 380-day exponential moving average in an end to the cyclical bull market from the March-2009 low. This countertrend rally would be had with very poor underlying advance/decline figures and slack volume patterns.
3) Lastly, the current decline that has nascently broken through the 380-day exponential moving average - continues its extension lower without an relief or respite rally whatsoever. This would along the lines of a "mini-crash" or perhaps something even more dour. This would be the "tail risk" event that very few are expecting.
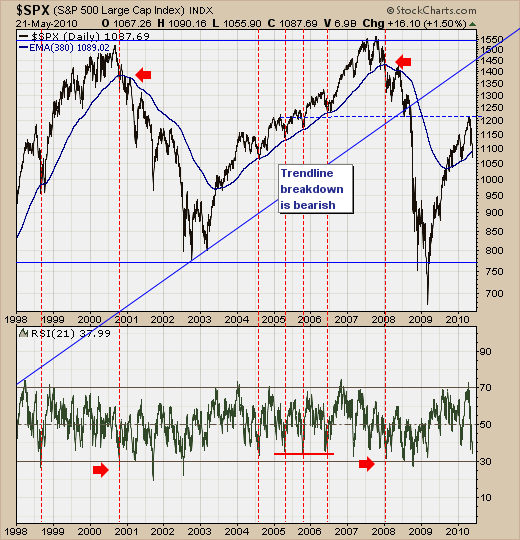
Having said this, the odds obviously favor one of the first two scenarios, with the first scenario in all probability being the "most likely" at this juncture. We have a difficult time postulating this course, but the technical evidence at the recent highs were coexistent with simply an interim high rather than a high formed by major negative divergences or non-confirmations. Lowry's rightly notes that all major bull market highs have had certain conditions attached to them; of which they were not present at the recent S&P high at 1217. They say we live in historically interesting times; and this case is no different. But is this time really different to warrant a different outcome than the probabilities suggest?
Good luck and good trading,
Richard